
| 일 | 월 | 화 | 수 | 목 | 금 | 토 |
|---|---|---|---|---|---|---|
| 1 | 2 | 3 | 4 | 5 | 6 | 7 |
| 8 | 9 | 10 | 11 | 12 | 13 | 14 |
| 15 | 16 | 17 | 18 | 19 | 20 | 21 |
| 22 | 23 | 24 | 25 | 26 | 27 | 28 |
| 29 | 30 |
- 크롤링
- 자연어처리
- 코딩애플
- 앱개발
- mnist
- 유데미
- pytorch
- 42경산
- 파이썬
- 선형회귀
- Regression
- Computer Vision
- 피플
- 크롤러
- 플러터
- filtering
- 회귀
- 머신러닝
- 인공지능
- 딥러닝
- RNN
- CV
- AI
- Flutter
- 42서울
- 모델
- 지정헌혈
- map
- 선형대수학
- 데이터분석
- Today
- Total
David의 개발 이야기!
OpenCV 에 대해 알아보자 본문
OpenCV 는 영상처리와 컴퓨터 비전을 위한 오프소스 라이브러리이다.
C, C++, Python 등에서 사용 가능하다.
[관련함수 소개]
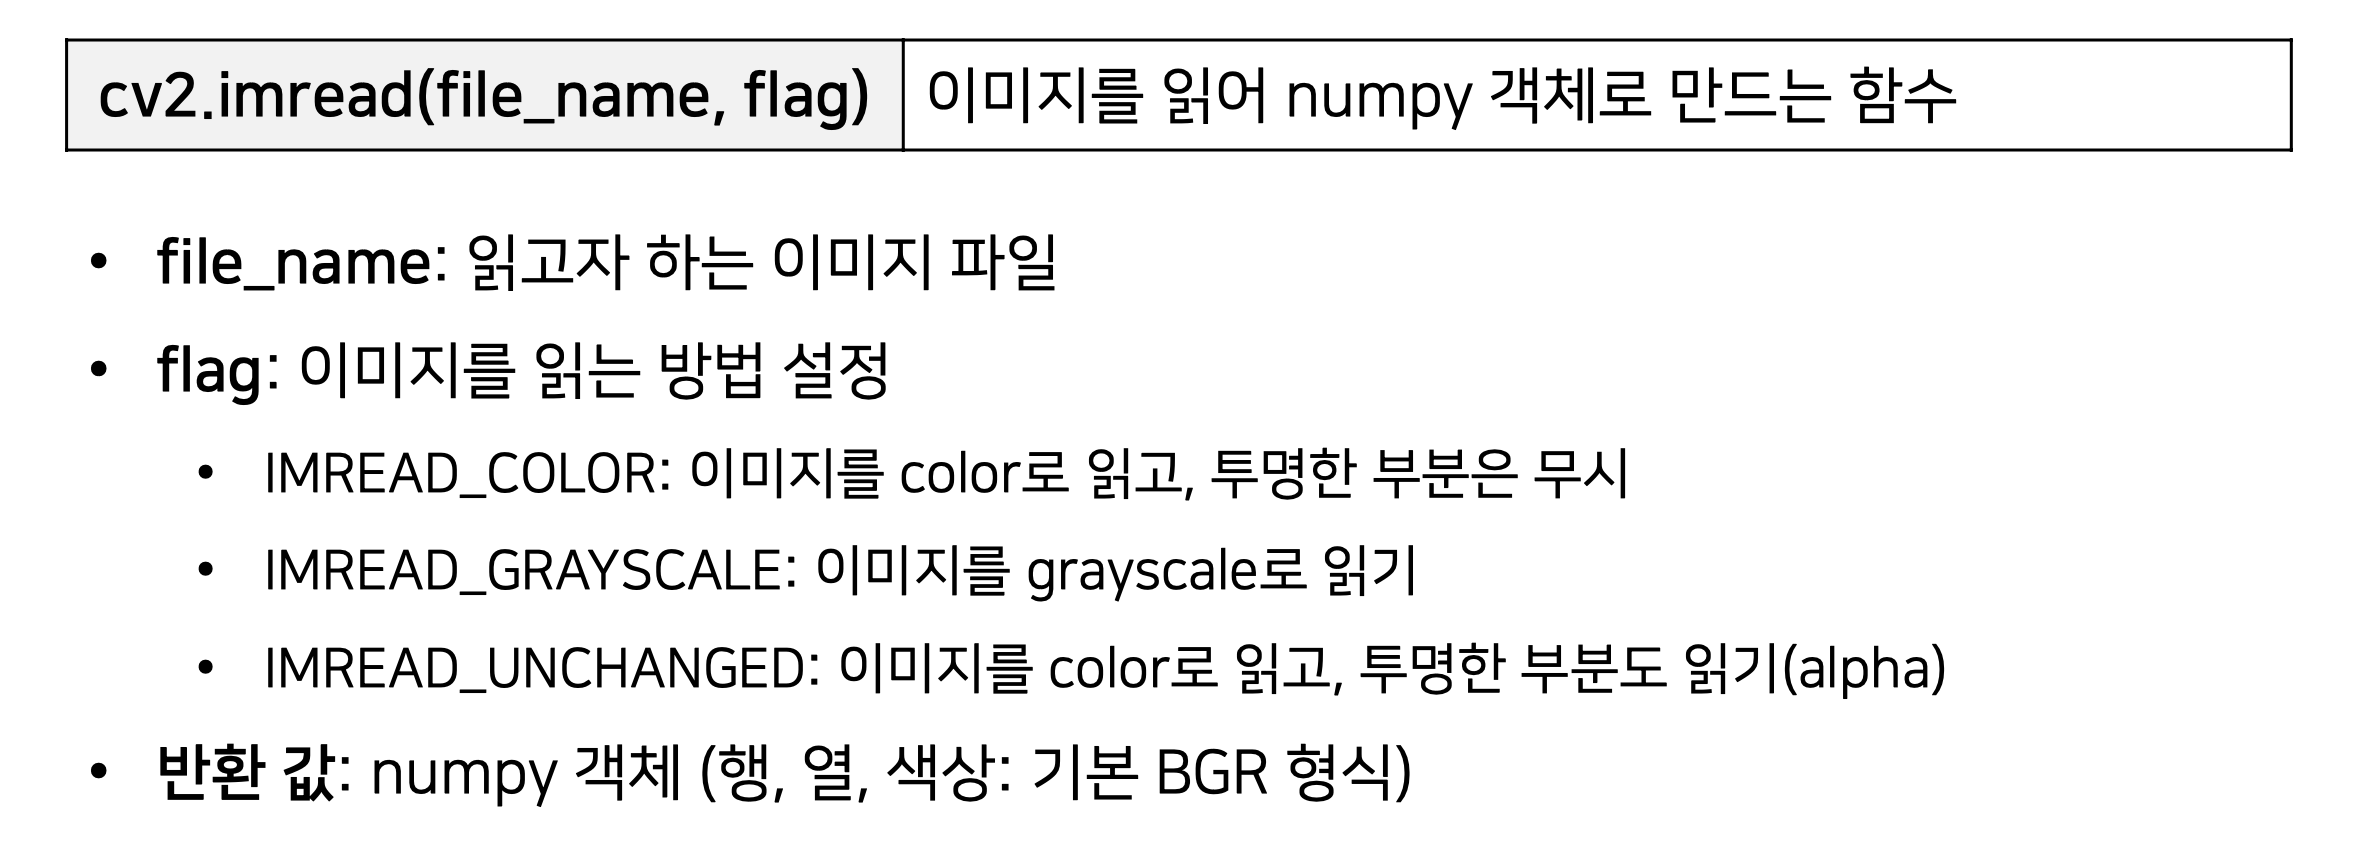
1. cv2.imread(file_name, flag)
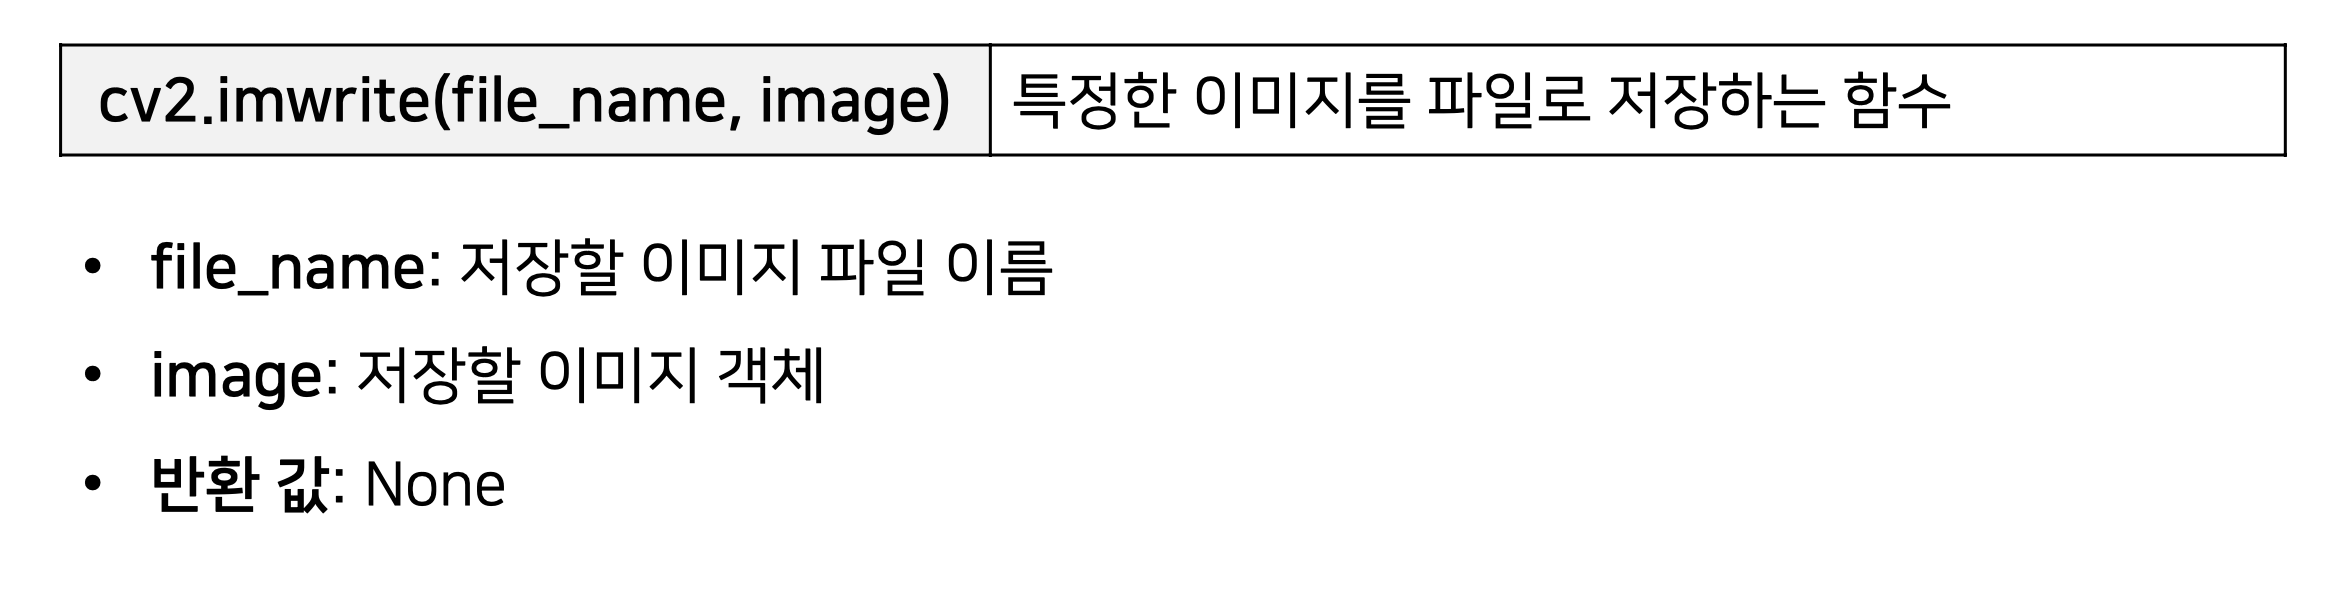
2. cv2.imwrite(file_name, flag)
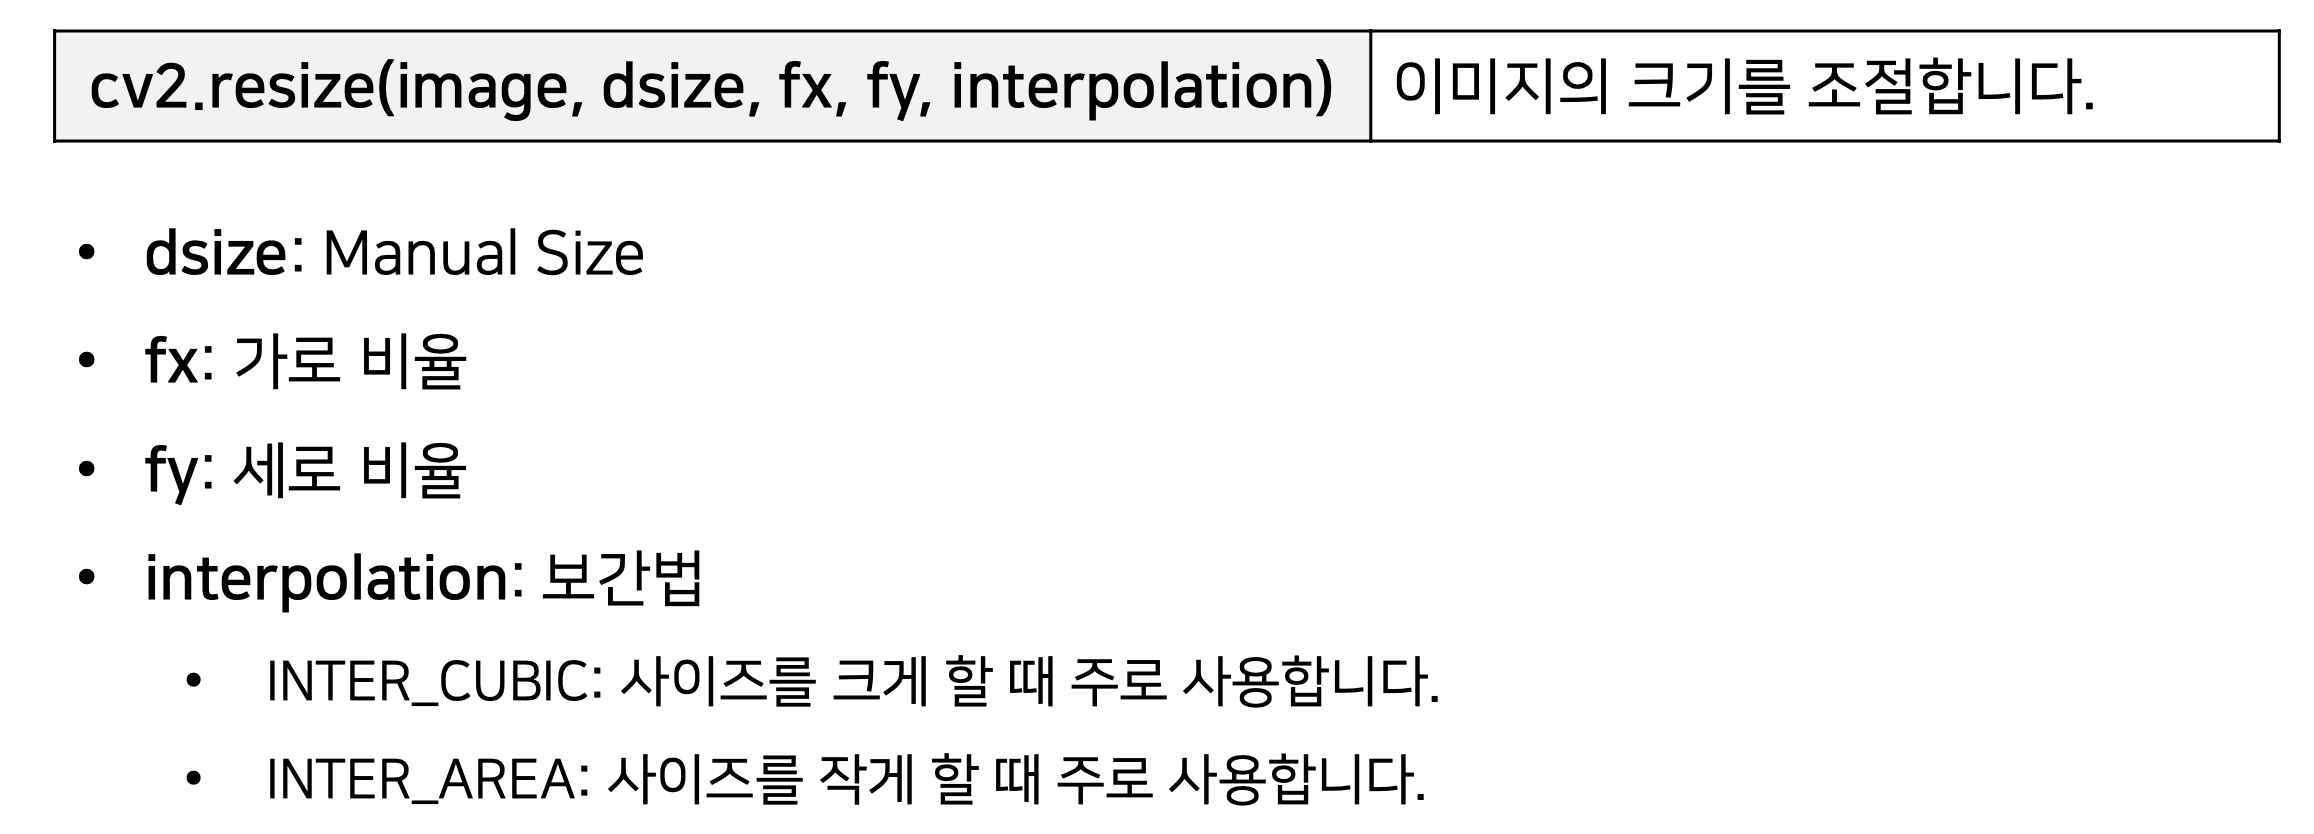
3. cv2.resize(image, dsize, fx, fy, interpolation)
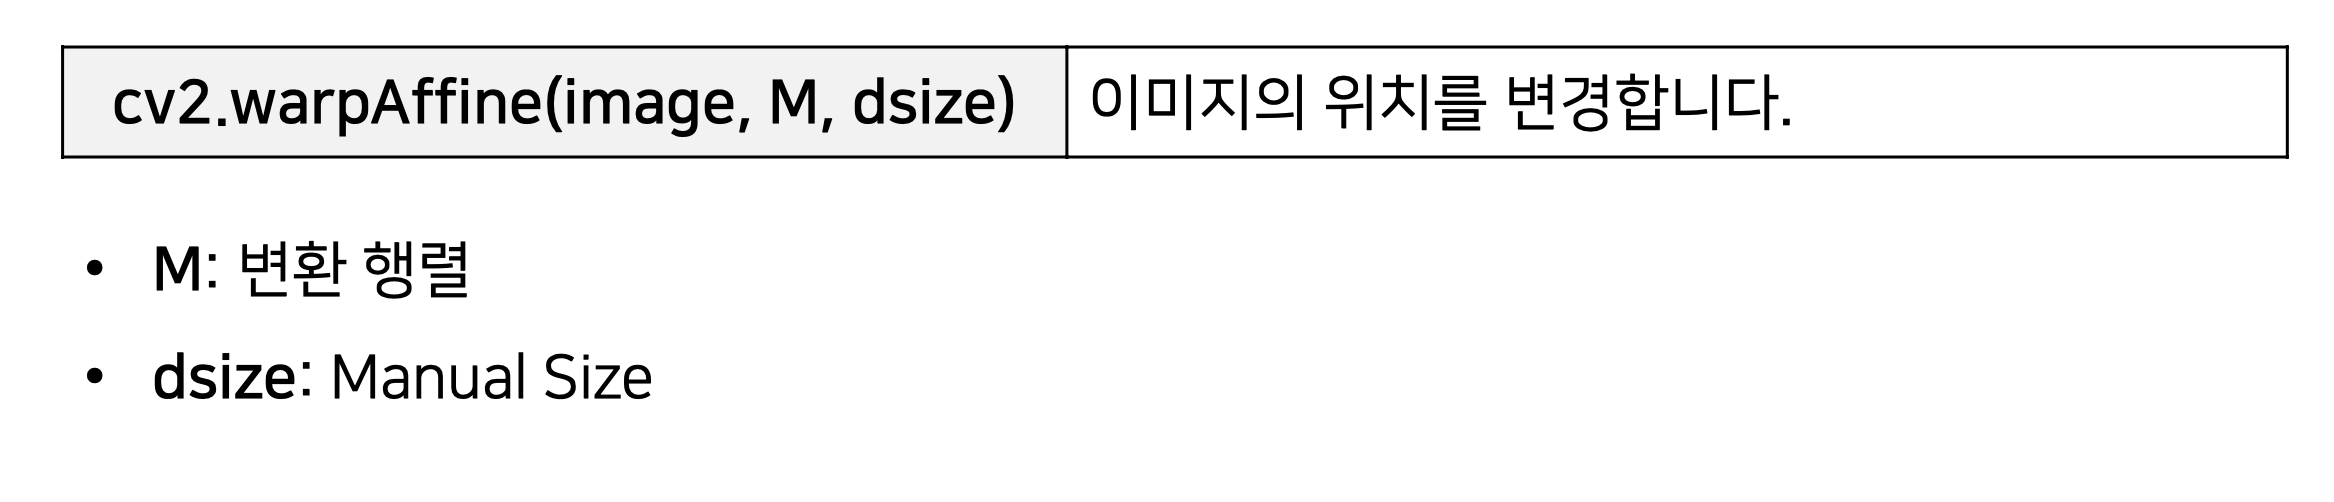
4. cv2.warpAffine(image, M, dsize)
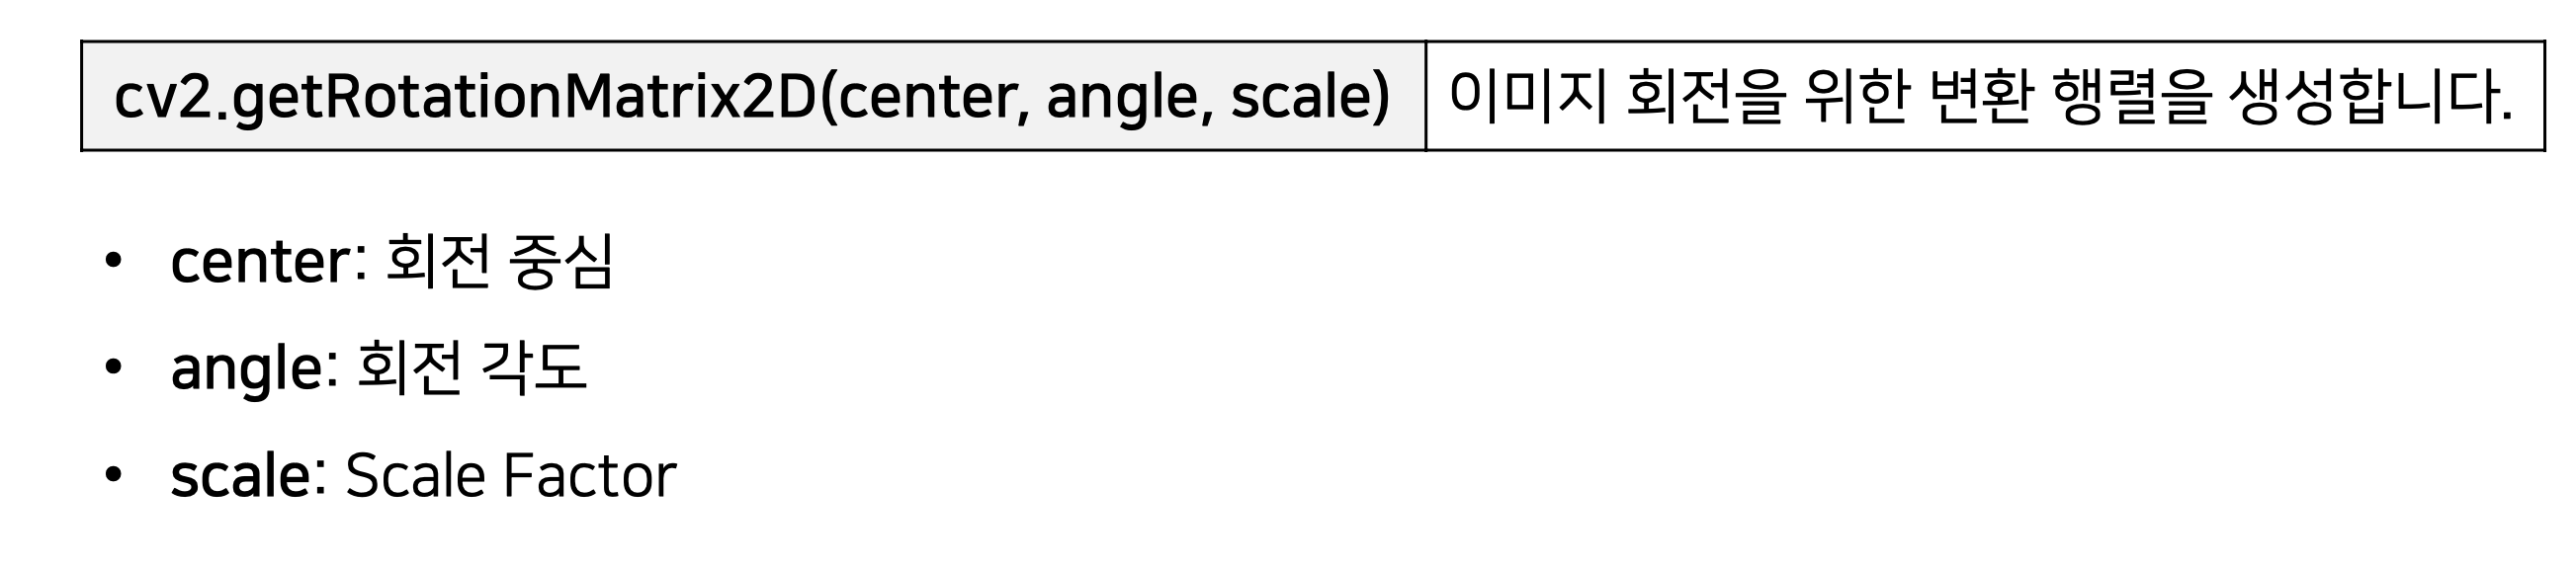
4. cv2.getRotationMatrix2D(center, angle, scale)
5. cv2.add()
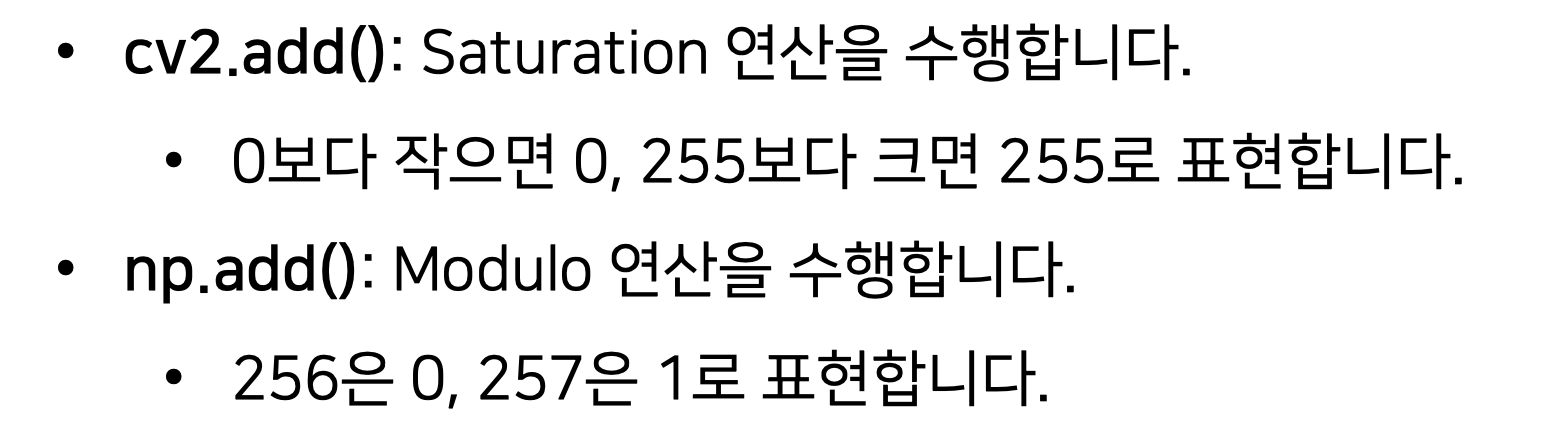
* Saturation 연산
-> 두개의 이미지를 각각의 픽셀 단위로 덧셈을 한 후, 255보다 큰 경우 255를 픽셀 값으로 설정
(250 + 7 = 257 -> 255)
* Modulo 연산
-> 두개의 이미지를 각각의 픽셀 단위로 덧셈을 하여, 255보다 큰 경우, 256으로 나눈 나머지를 픽셀값으로 설정
((250 + 7) = 257 / 256 = 1 )
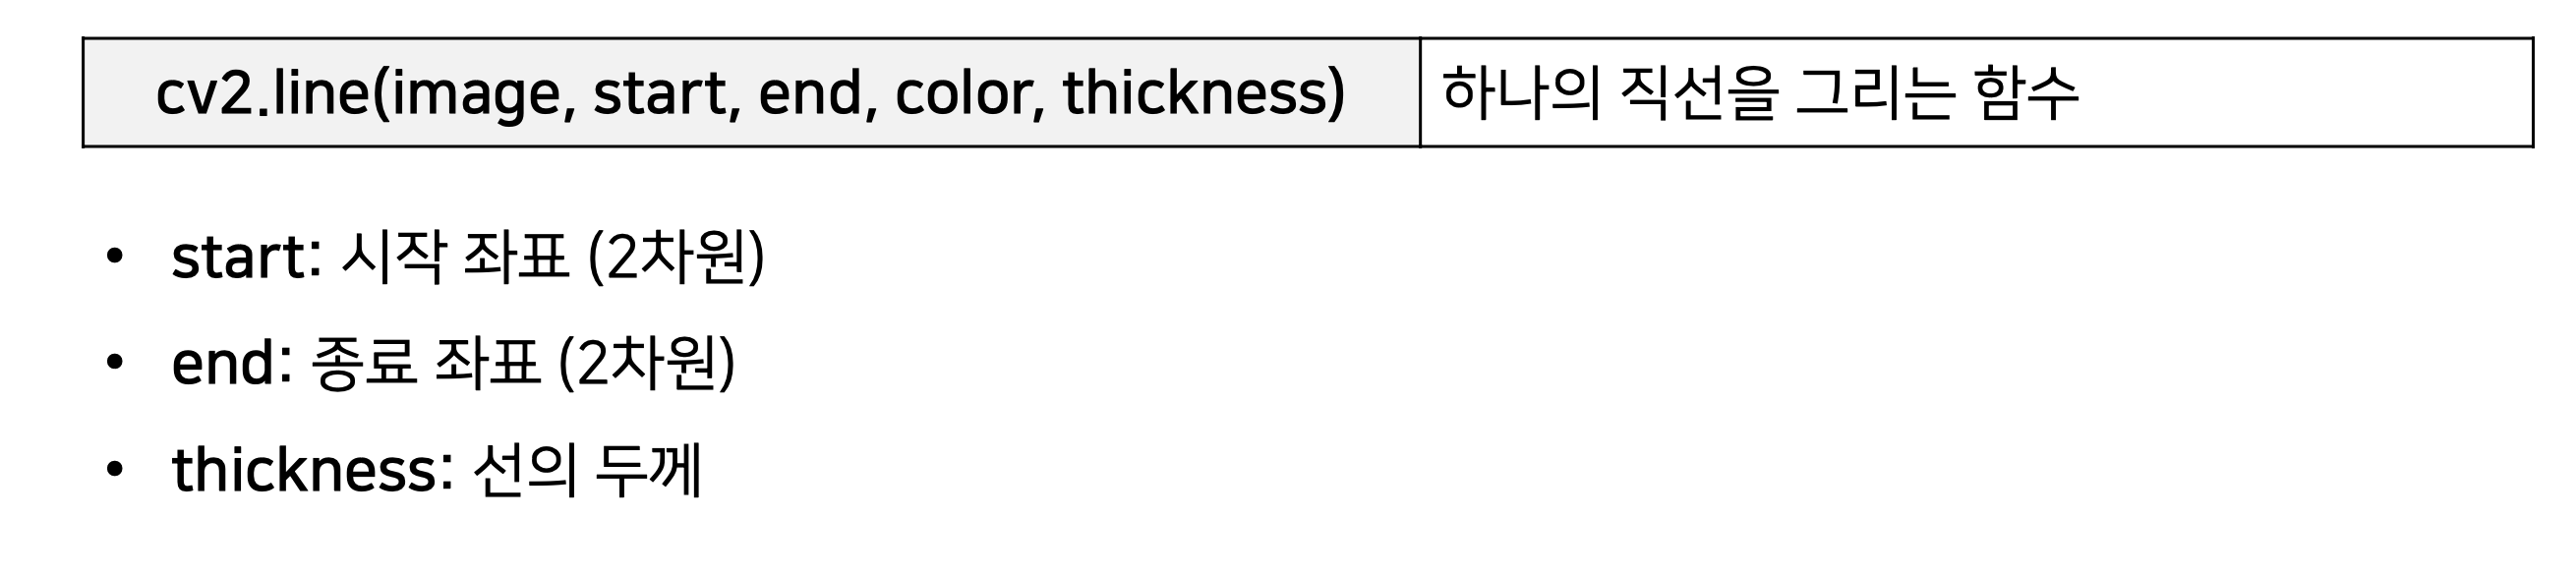
6. cv2.line(image, start, end, color, thickness)
7. cv2.rectangle(image, start, end, color, thickness)
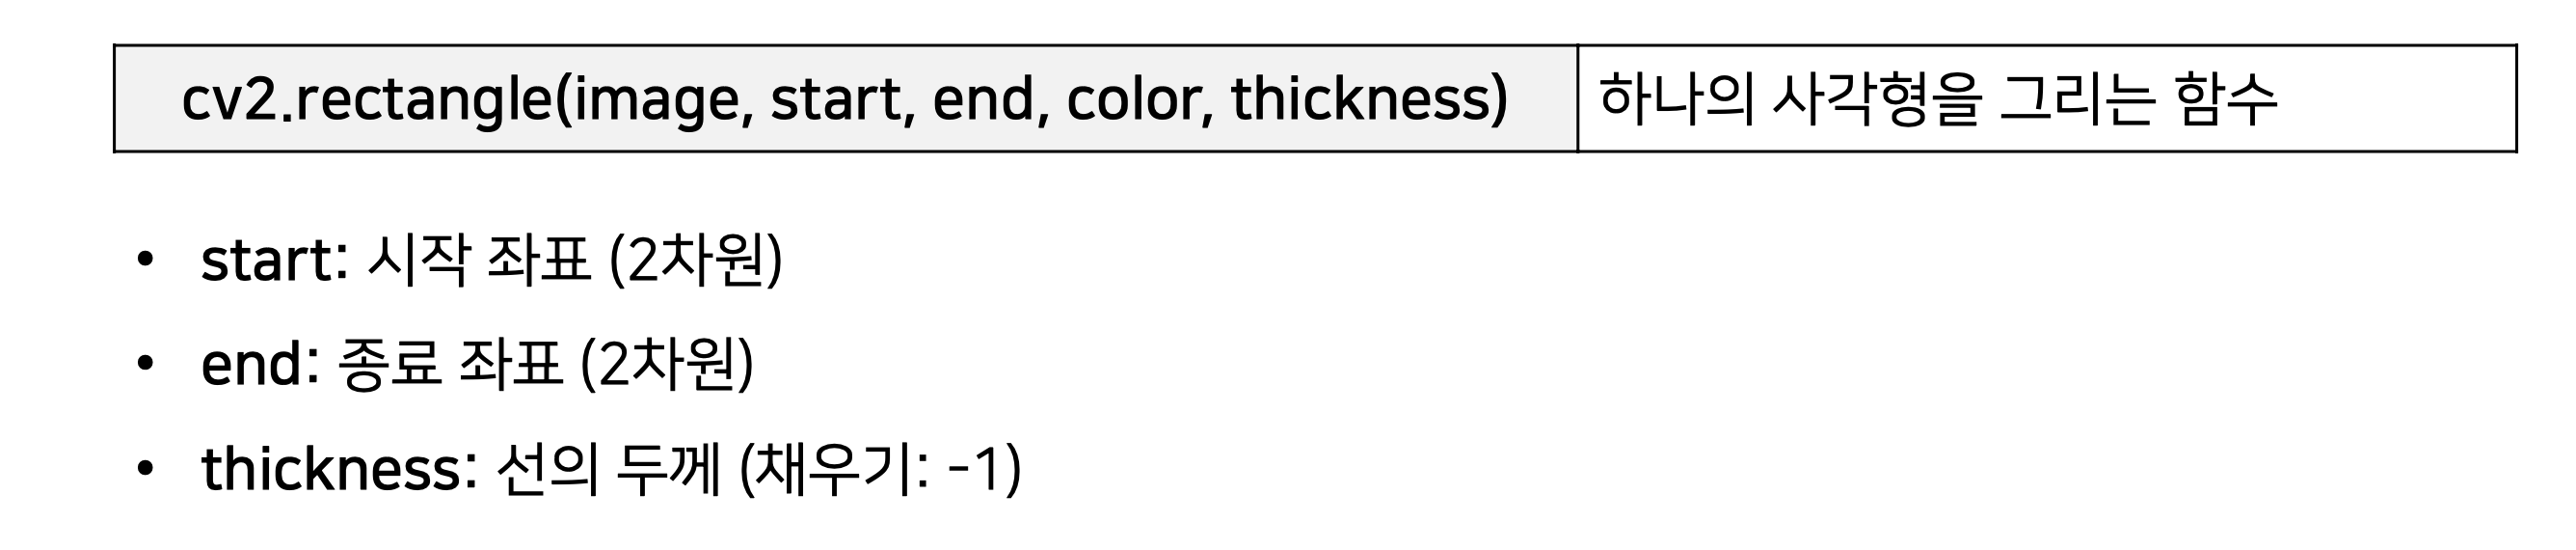
8. cv2.rectangle(image, start, end, color, thickness)

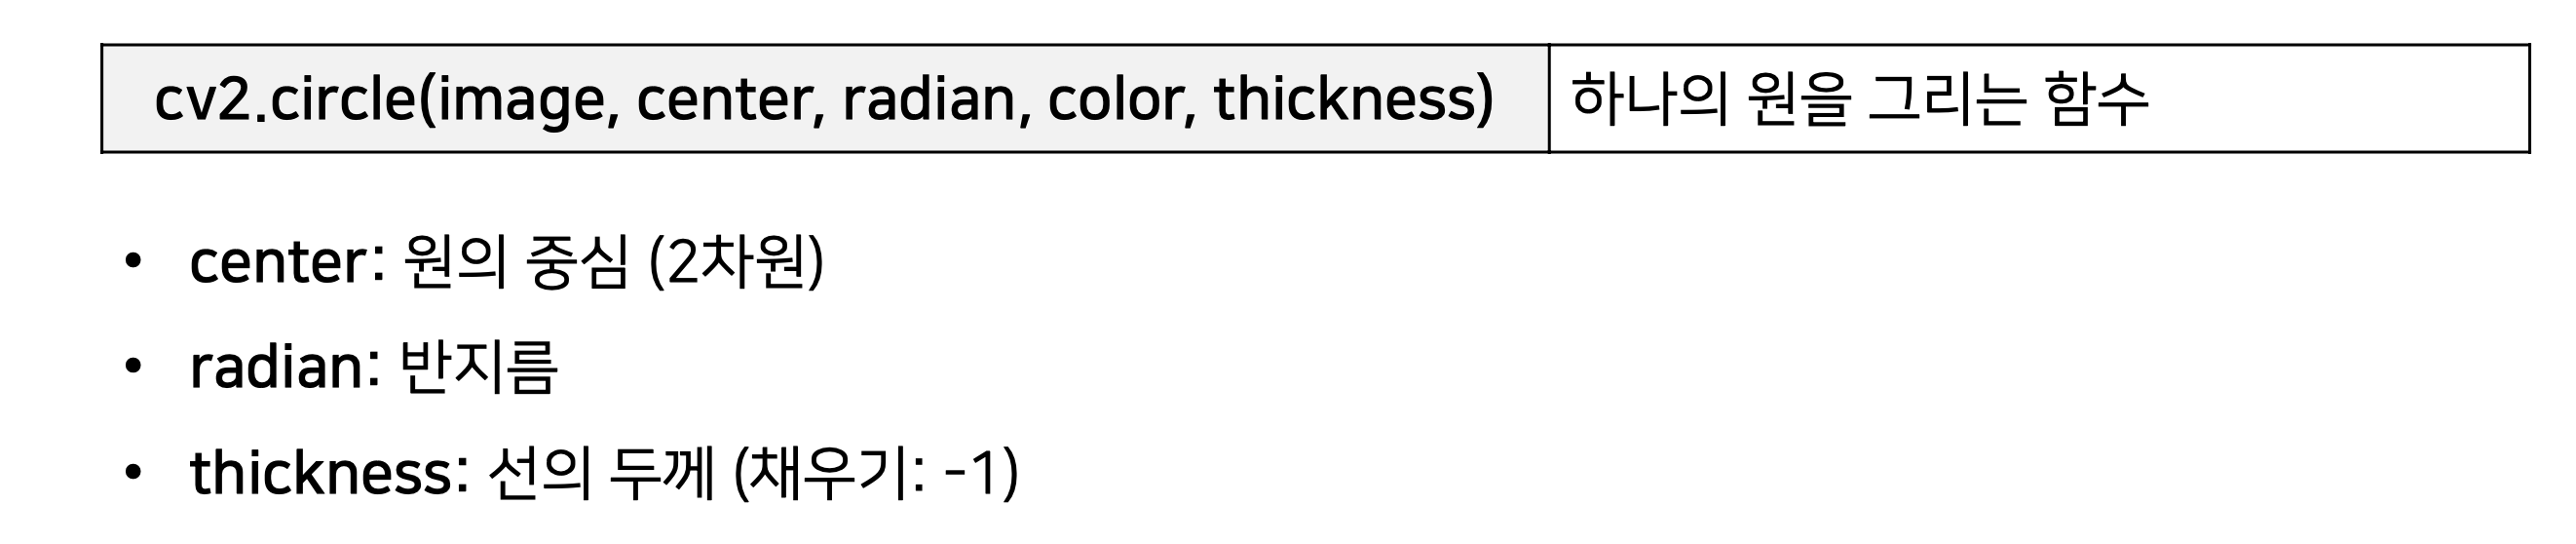
9. cv2.circle(image, center, radian, color, thickness)
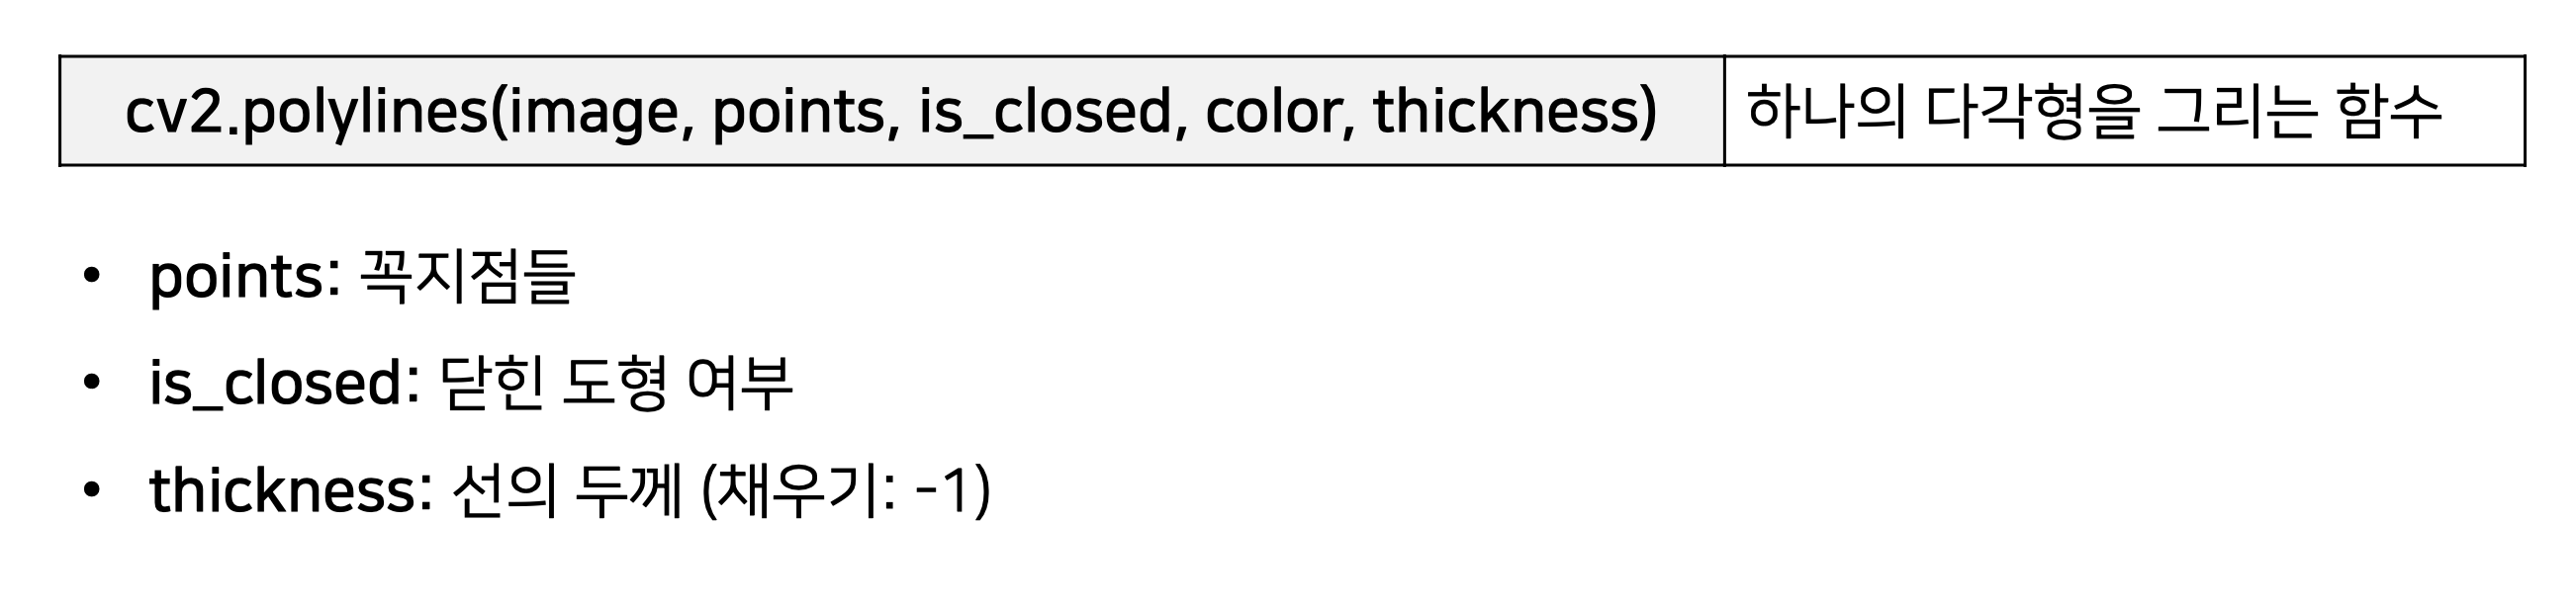
10. cv2.polylines(image, points, is_closed, color, thickness)
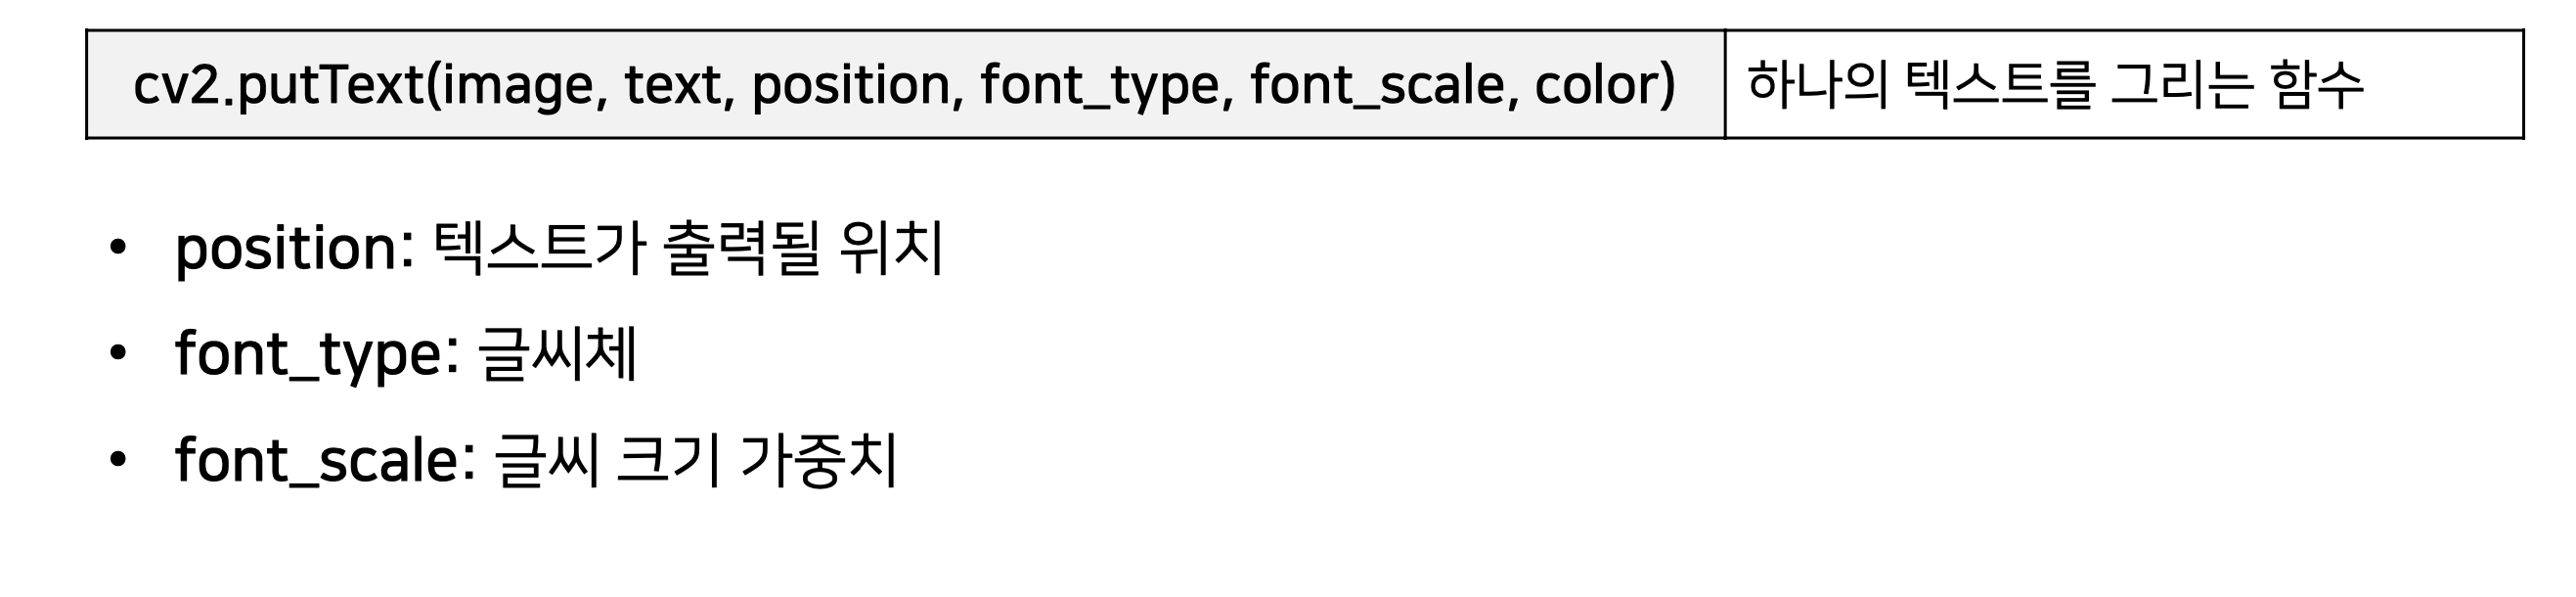
11. cv2.putText(image, text, position, font_type, font_scale, color)
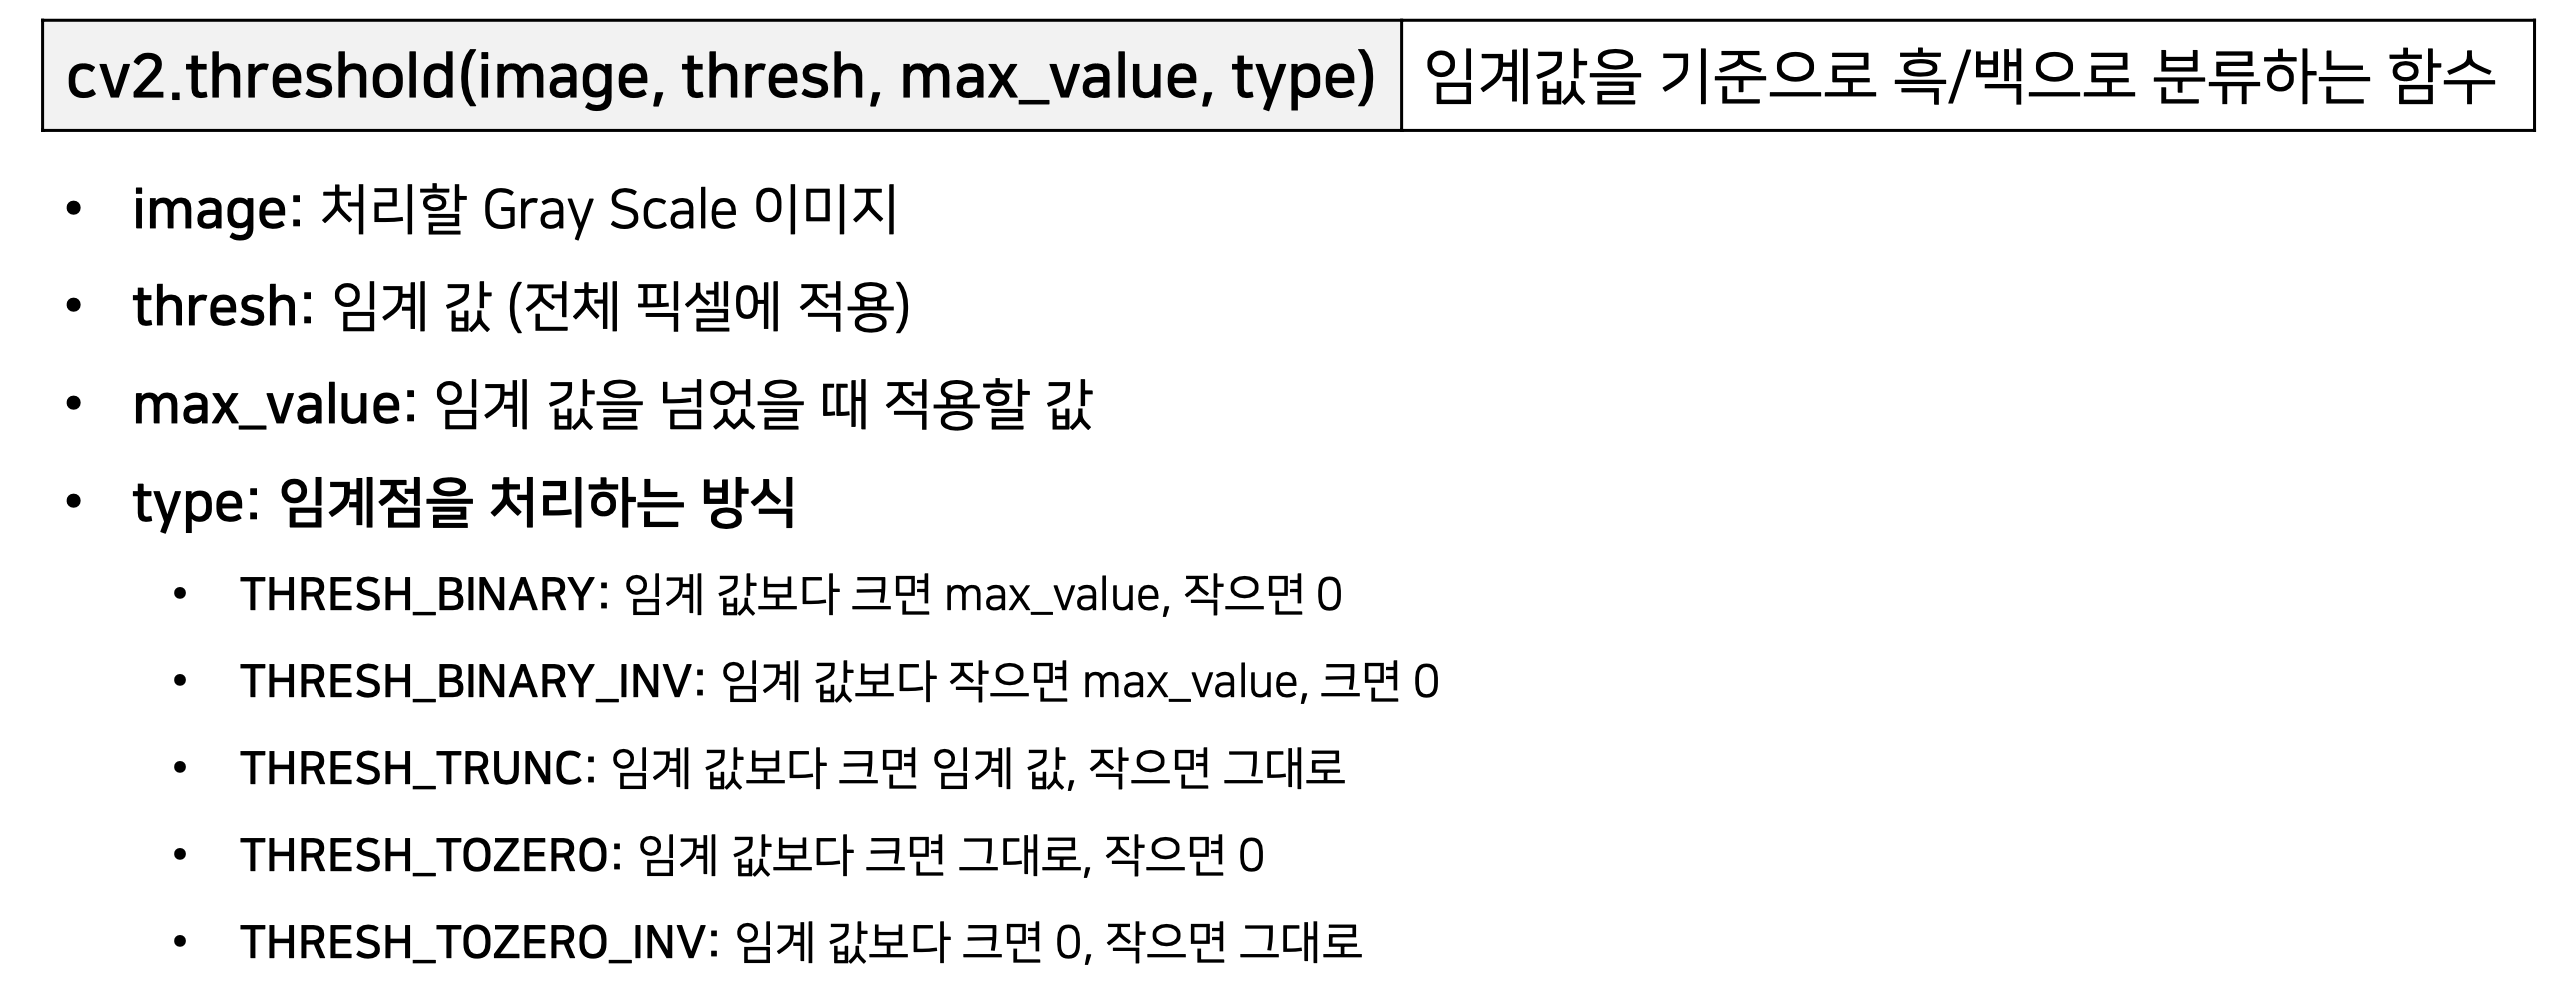
12. cv2.threshold(image, thresh, max_value, type) : 이미지의 이진화
12. cv2.adaptiveThreshold(image, max_value, adaptive_method, type, block_size, C) : 이미지의 적응 임계점 처리
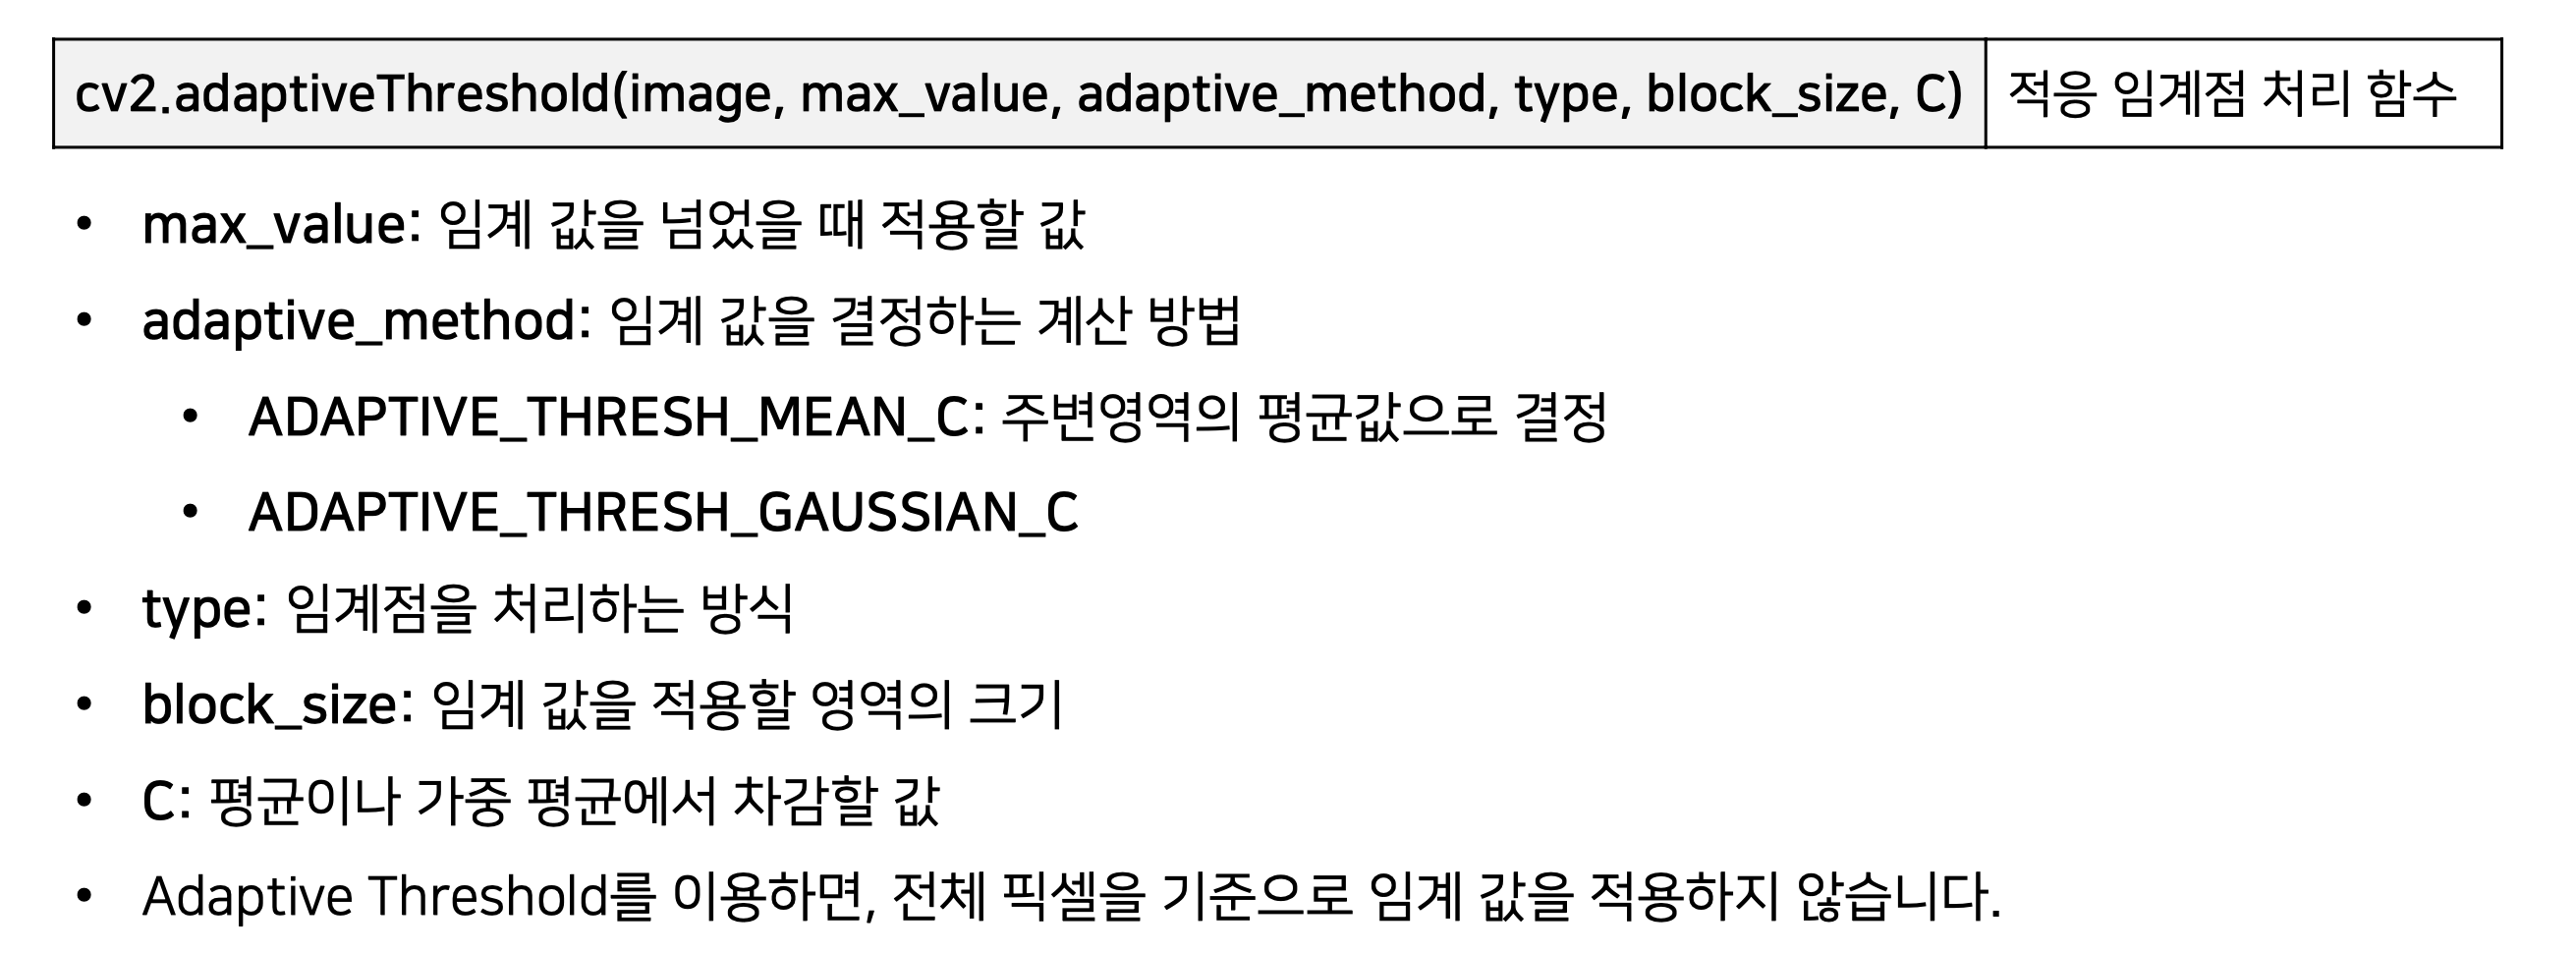
* ADAPTIVE_THRESH_MEAN_C
-> 적용할 픽셀 (x, y) 를 중ㅇ심으로 하는 block_size * block_size 안에 있는 픽셀 값의 평균에서 C값을 임계점으로 설정
* ADAPTIVE_THRESH_GAUSSIAN_C
-> 적용할 픽셀 (x, y) 를 중ㅇ심으로 하는 block_size * block_size 안에 있는 Gaussian 윈도우 기반의 가중치들의 합에서 C를 뺀 값을 임계점으로 설정
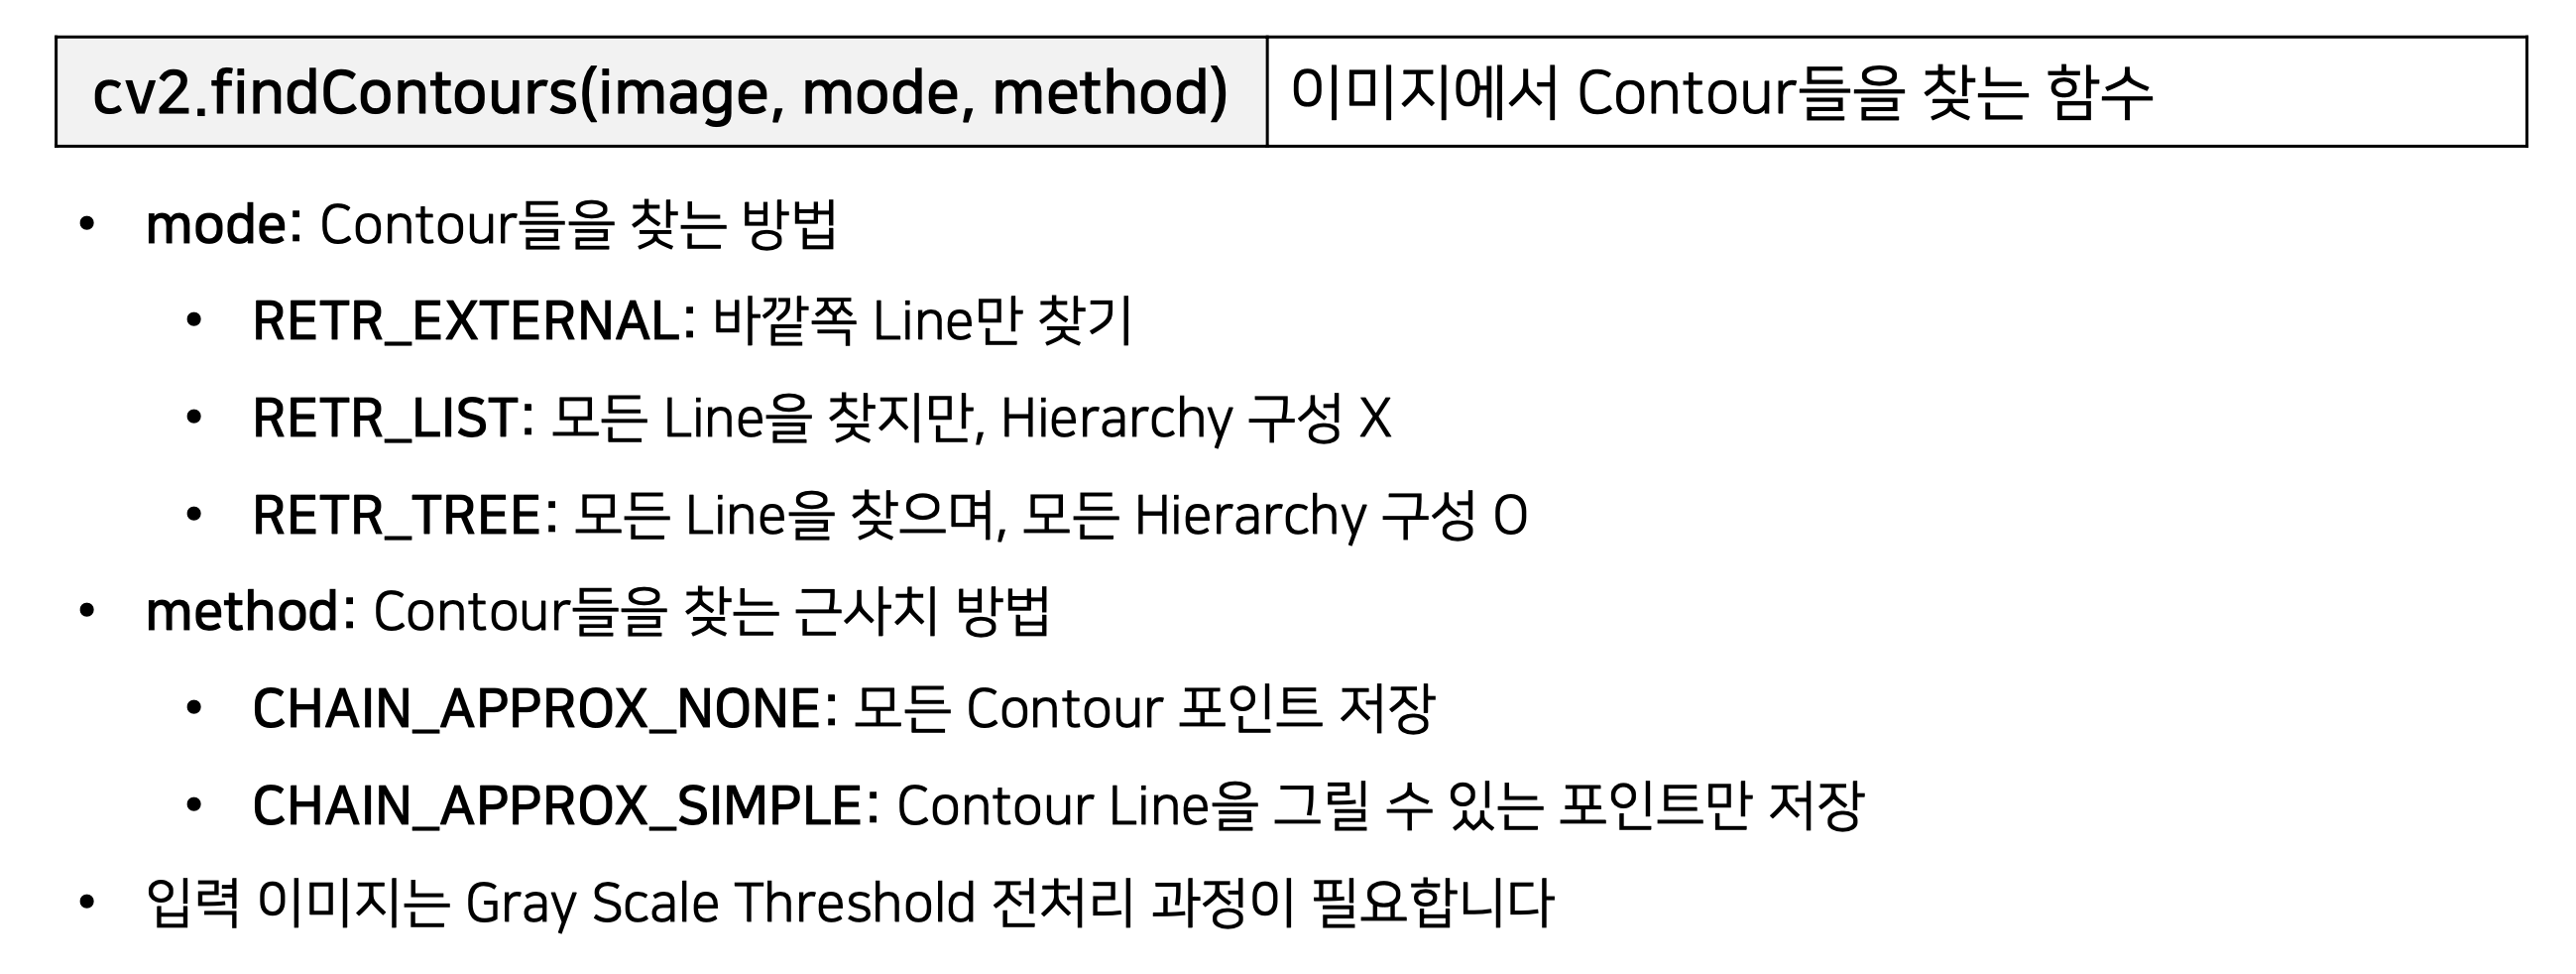
13. cv2.findContours(image, mode, method)
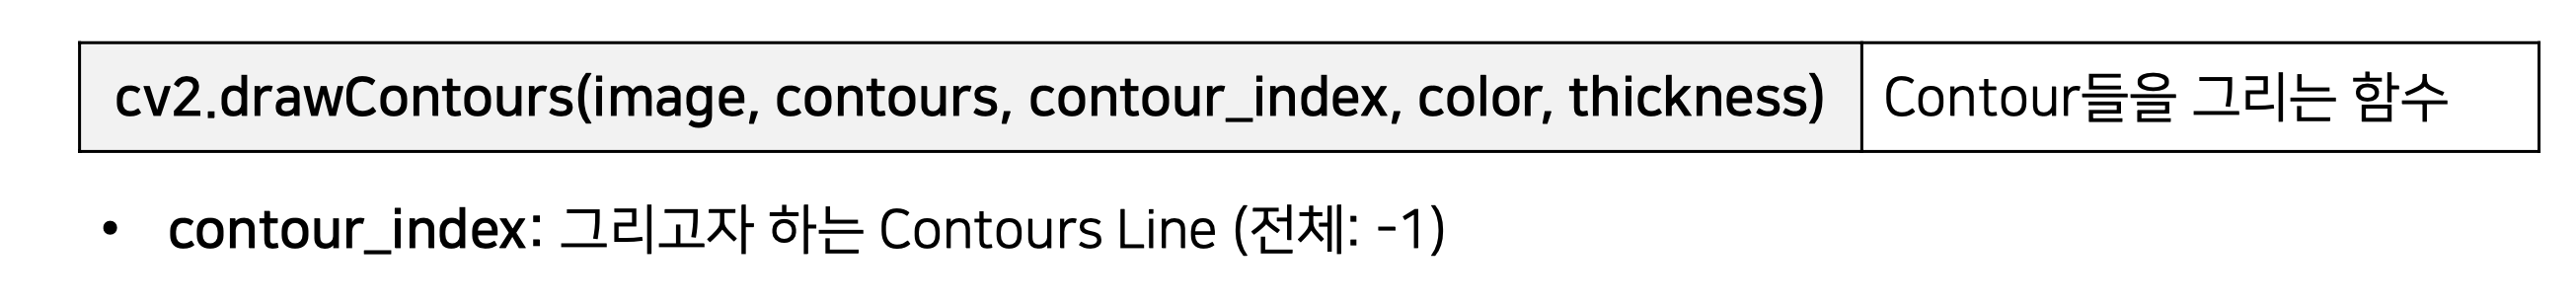
14. cv2.drawContours(image, contours, contour_index, color, thickness)
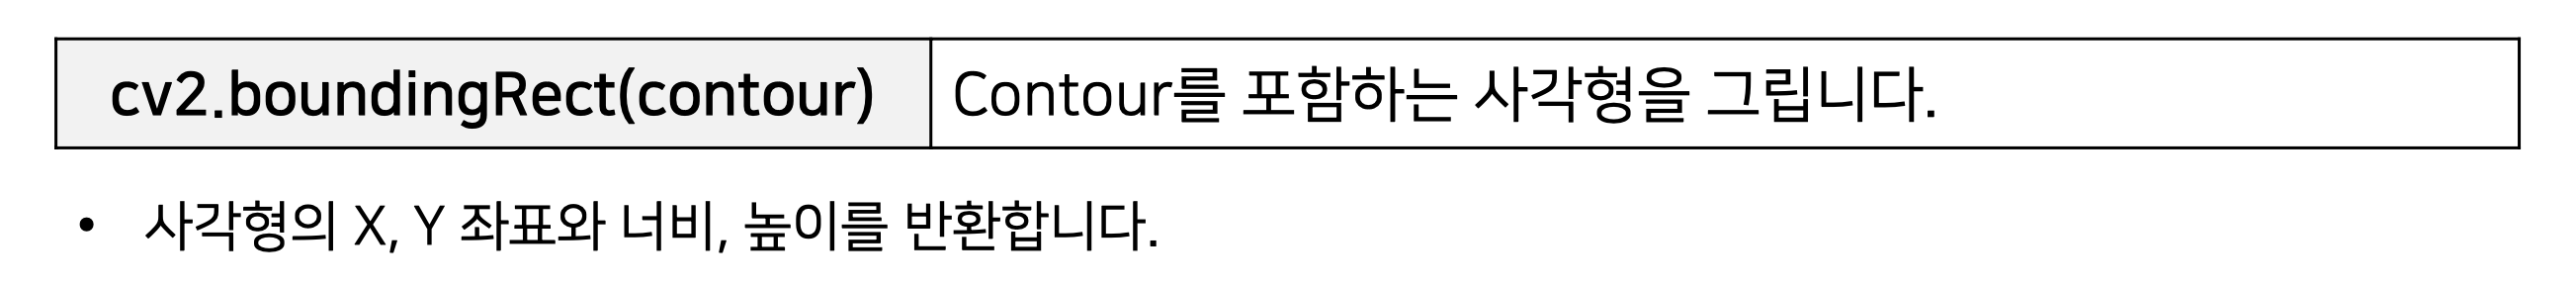
14. cv2.boundingRect(contour)
15. cv2.convexHull(contour)

16. cv2.approxPolyDP(curve, epsilon, closed)

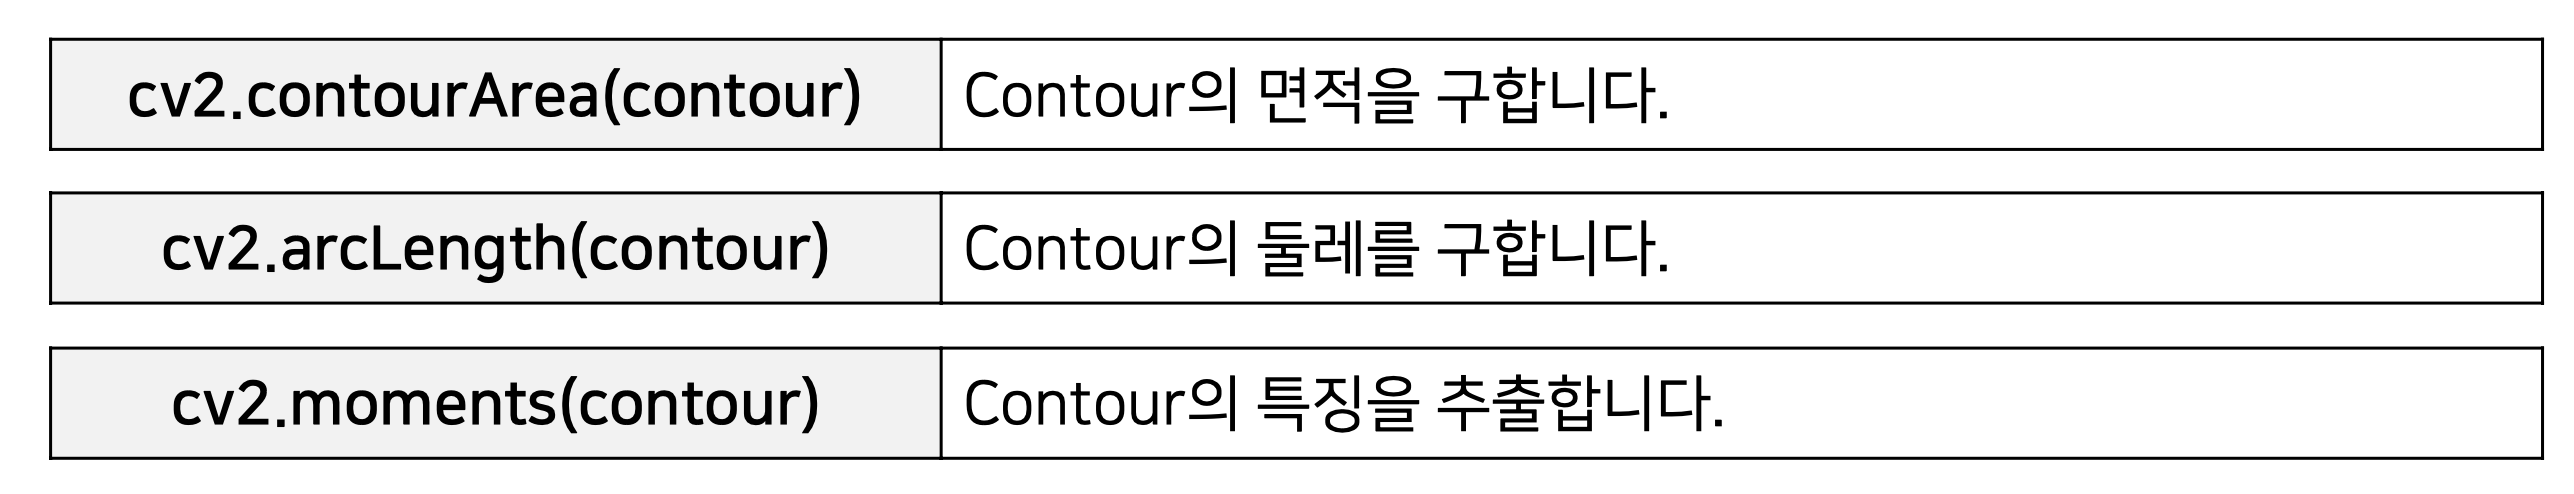
16. cv2.contourArea(contour) / cv2.arcLength(contour) / cv2.moments(contour)
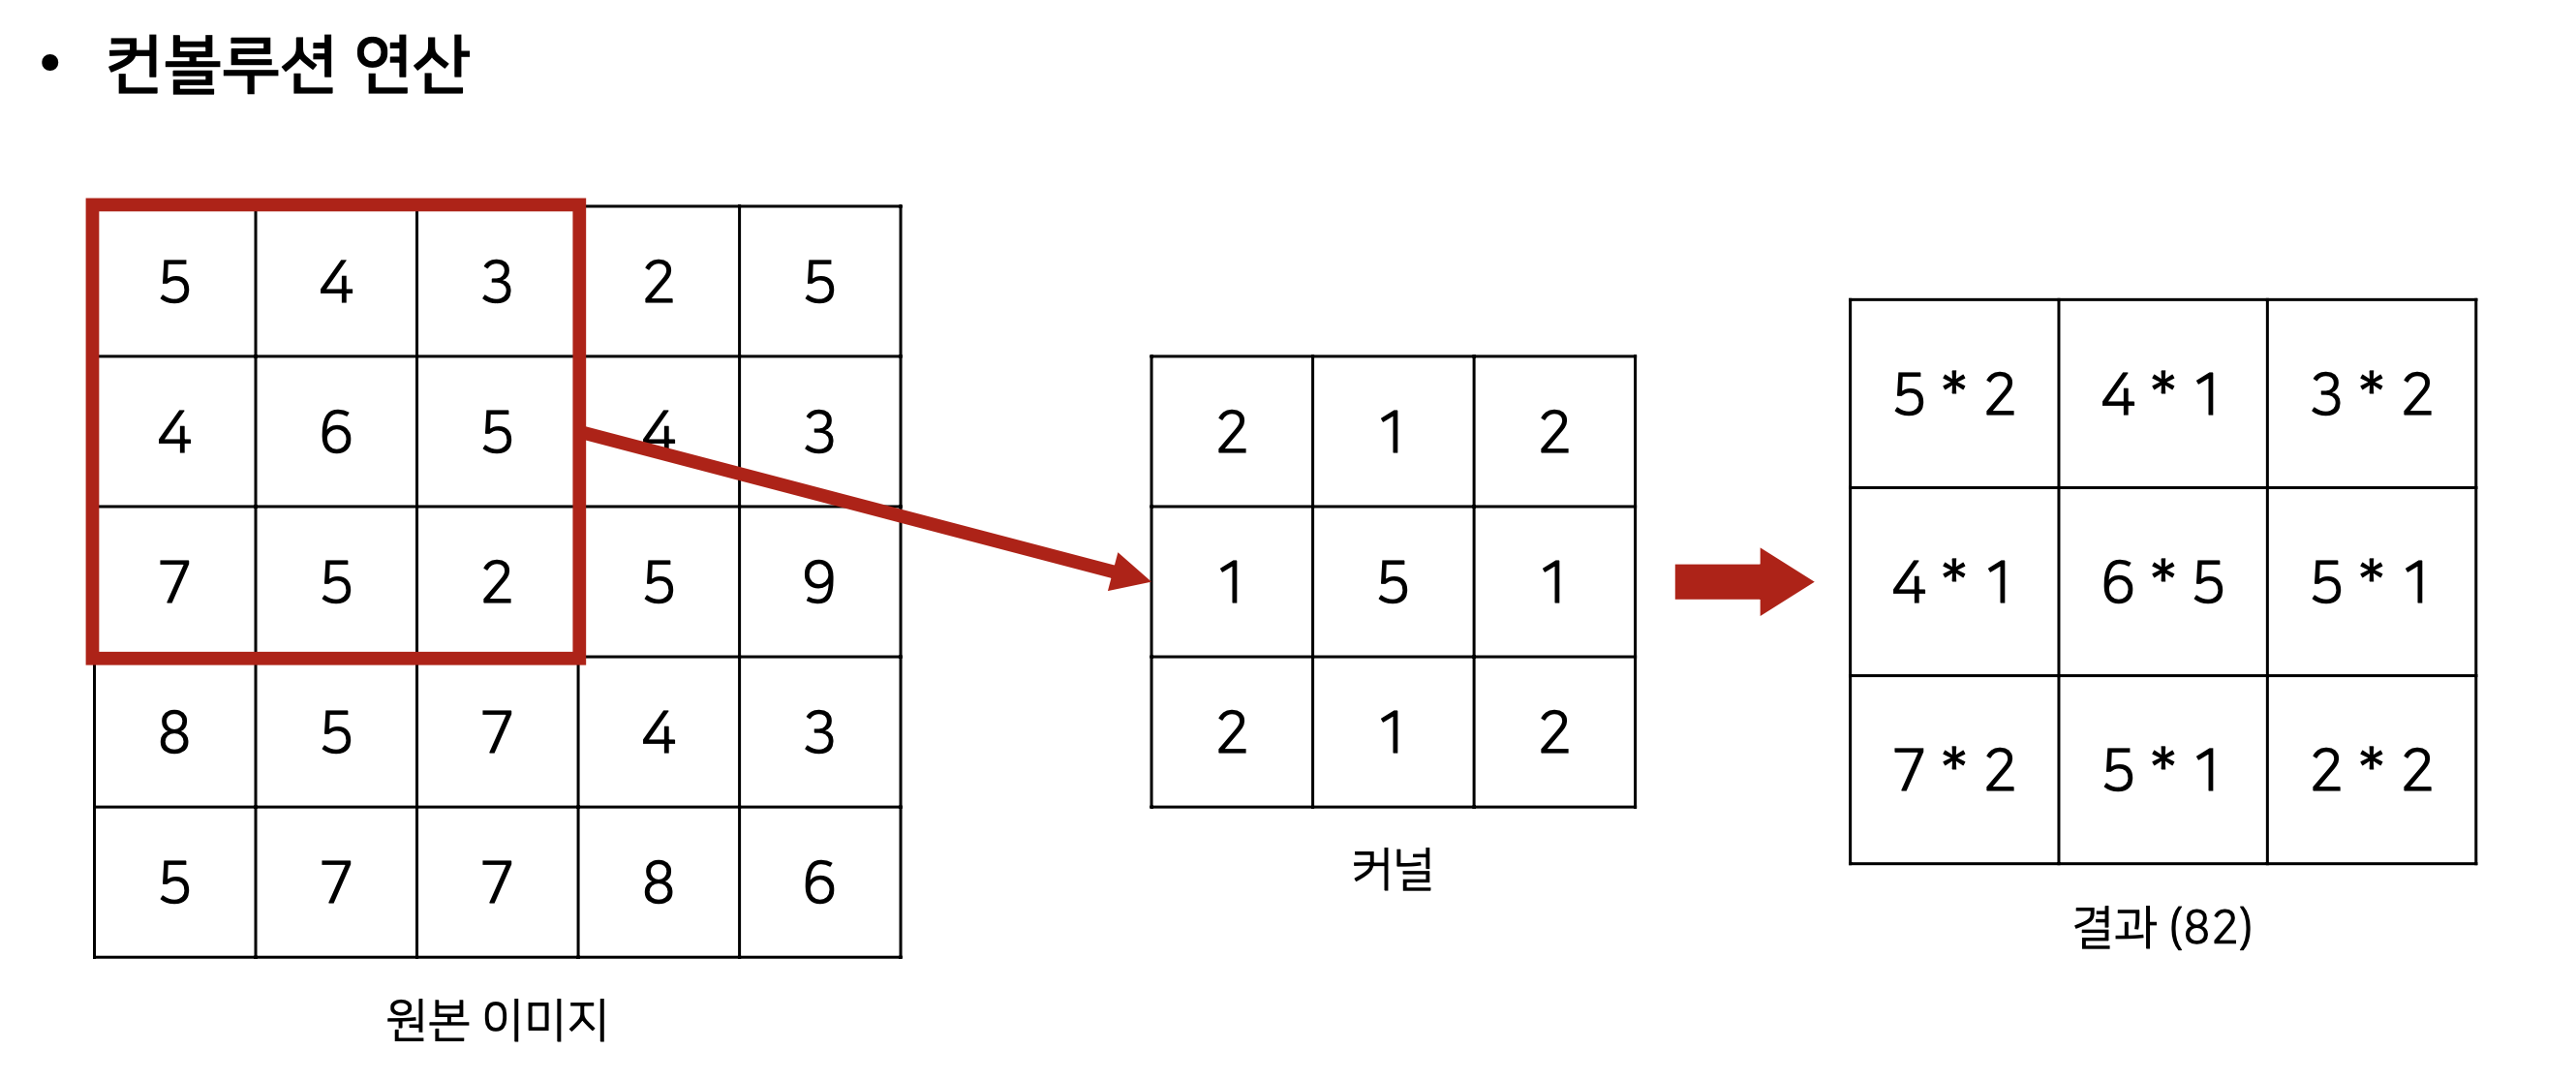
17. 이미지 필터링
- 이미지에 커널을 적용하여, 이미지를 흐리게 (Blurring = Smoothing) 처리할 수 있음.
- 이미지를 흐리게 만들면 노이즈 및 손상을 줄일 수 있음.
- 특정한 이미지에서 커널(Kernel) 을 적용해 컨볼루션 연산하여 필터링을 수행할 수 있음.
- basic blur (기본적인)
- 가우시안 blur
가 있음.
가우시안 blur는, basic blur 와 다르게, 중심에 있는 픽셀에 높은 가중치를 부여하여, Edge 검출을 할 때 사용.
[OpenCV 사용방법 - 코드]
1. 이미지 읽어서 살펴보기
import cv2
import matplotlib.pyplot as plt

img_basic = cv2.imread('cat.jpg', cv2.IMREAD_COLOR)
plt.imshow(cv2.cvtColor(img_basic, cv2.COLOR_BGR2RGB))
plt.show()

img_basic = cv2.cvtColor(img_basic, cv2.COLOR_BGR2GRAY)
plt.imshow(cv2.cvtColor(img_basic, cv2.COLOR_GRAY2RGB))
plt.show()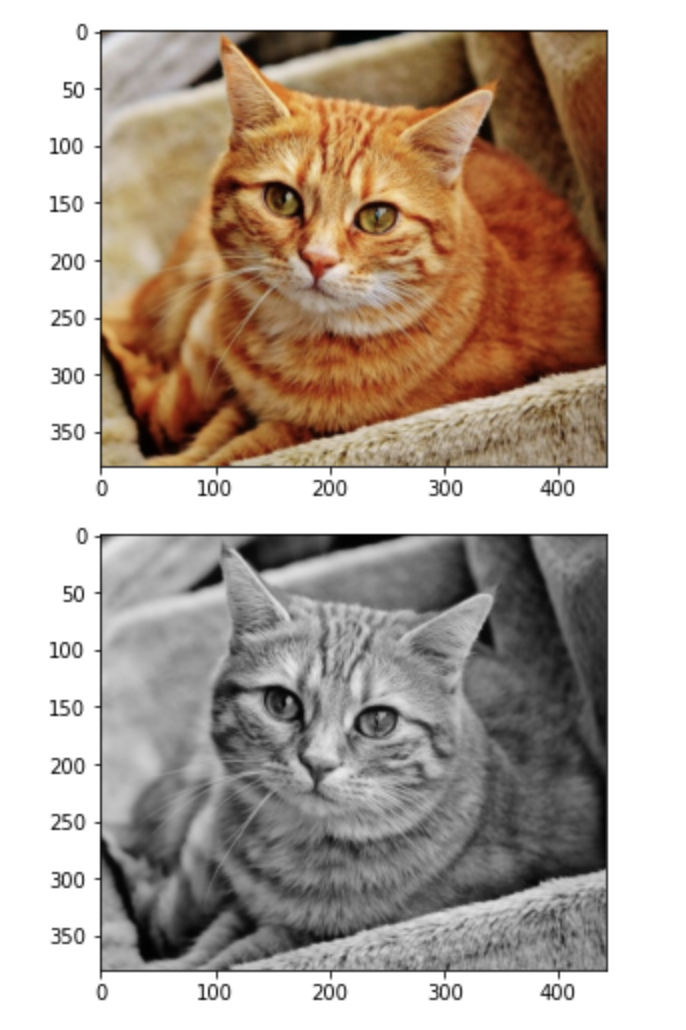
* cv2.cvtColor()
- BGR2RGB : BGR을 RGB 로 반전
2. 이미지 크기 및 픽셀 확인
import cv2

image = cv2.imread('cat.jpg')
# 픽셀 수 및 이미지 크기 확인
print(image.shape)
print(image.size)

# 이미지 Numpy 객체의 특정 픽셀을 가리킵니다.
px = image[100, 100]

# B, G, R 순서로 출력됩니다.
# Gray Scale: B, G, R로 구분되지 않습니다.
print(px)

# R 값만 출력하기
print(px[2])
(380, 441, 3)
502740
[111 151 179]
179
3. 특정 범위 픽셀 변경
import cv2
import matplotlib.pyplot as plt
import time

image = cv2.imread('cat.jpg')

start_time = time.time()
for i in range(0, 100):
    for j in range(0, 100):
        image[i, j] = [255, 255, 255]
print("--- %s seconds ---" % (time.time() - start_time))

plt.imshow(cv2.cvtColor(image, cv2.COLOR_BGR2RGB))
plt.show()

image = cv2.imread('cat.jpg')

start_time = time.time()
image[0:100, 0:100] = [0, 0, 0]
print("--- %s seconds ---" % (time.time() - start_time))

plt.imshow(cv2.cvtColor(image, cv2.COLOR_BGR2RGB))
plt.show()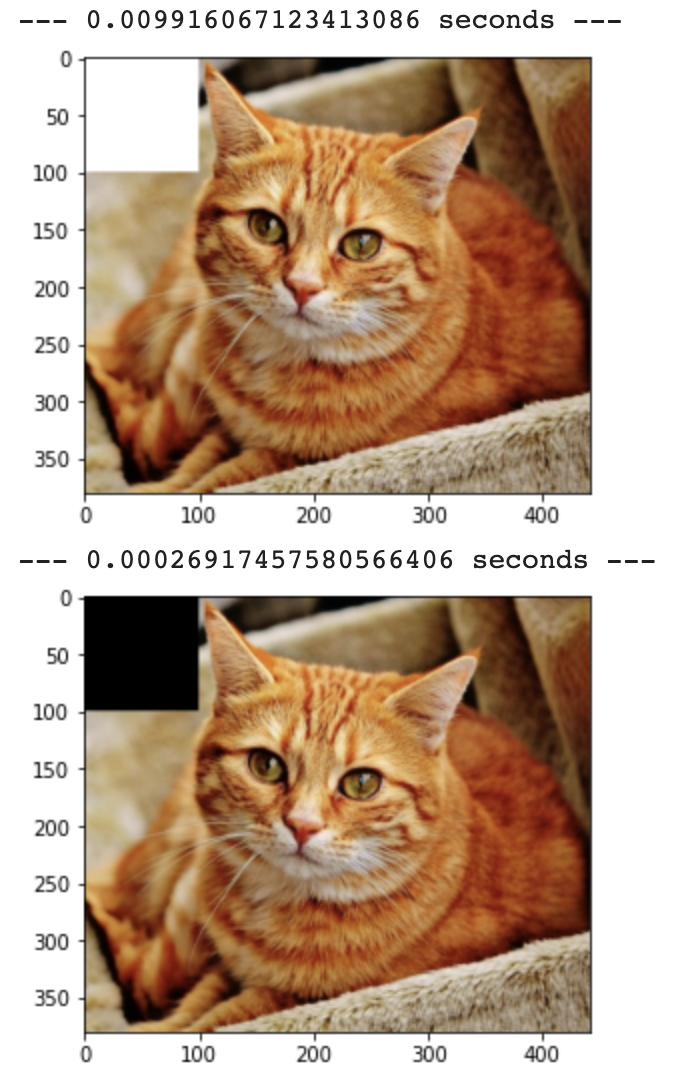
4. ROI 추출 및 복사 : ROI = Region Of Interest, 관심영역
import cv2
import matplotlib.pyplot as plt

image = cv2.imread('cat.jpg')

# Numpy Slicing: ROI 처리 가능
roi = image[200:350, 50:200]

# ROI 단위로 이미지 복사하기
image[0:150, 0:150] = roi

plt.imshow(cv2.cvtColor(image, cv2.COLOR_BGR2RGB))
plt.show()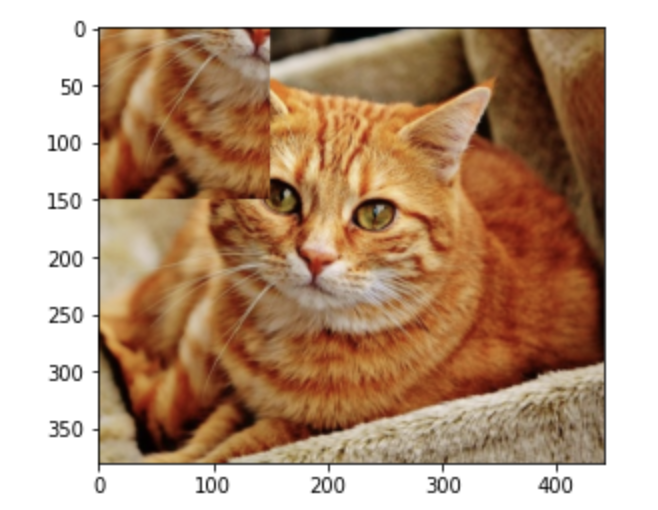
5. 픽셀별로 색상 다루기
import cv2
import matplotlib.pyplot as plt

# 특정 색상만 제거하기(0: Blue, 1: Green, 2: Red)
Image = cv2.imread('cat.jpg')
Image[:, :, 2] = 0

# 이미지 출력하기
plt.imshow(cv2.cvtColor(image, cv2.COLOR_BGR2RGB))
plt.show()
'cat.jpg' 파일에서 이미지를 읽고, 이미지의 Red 채널을 0으로 설정하여 빨간색을 제거한 뒤, 변경된 이미지를 시각화하는 예제. 이 코드를 실행하면 빨간색이 제거된 이미지가 출력됨.
6.이미지 크기 조절
import cv2
import matplotlib.pyplot as plt

image = cv2.imread('cat.jpg')
plt.imshow(cv2.cvtColor(image, cv2.COLOR_BGR2RGB))
plt.show()

expand = cv2.resize(image, None, fx=2.0, fy=2.0, interpolation=cv2.INTER_CUBIC)
plt.imshow(cv2.cvtColor(expand, cv2.COLOR_BGR2RGB))
plt.show()

shrink = cv2.resize(image, None, fx=0.2, fy=0.2, interpolation=cv2.INTER_AREA)
plt.imshow(cv2.cvtColor(shrink, cv2.COLOR_BGR2RGB))
plt.show()
7. 이미지 위치 변경
import cv2
import numpy as np
import matplotlib.pyplot as plt

image = cv2.imread('cat.jpg')

# 행과 열 정보만 저장합니다.
height, width = image.shape[:2]

M = np.float32([[1, 0, 50], [0, 1, 10]])
dst = cv2.warpAffine(image, M, (width, height))

plt.imshow(cv2.cvtColor(dst, cv2.COLOR_BGR2RGB))
plt.show()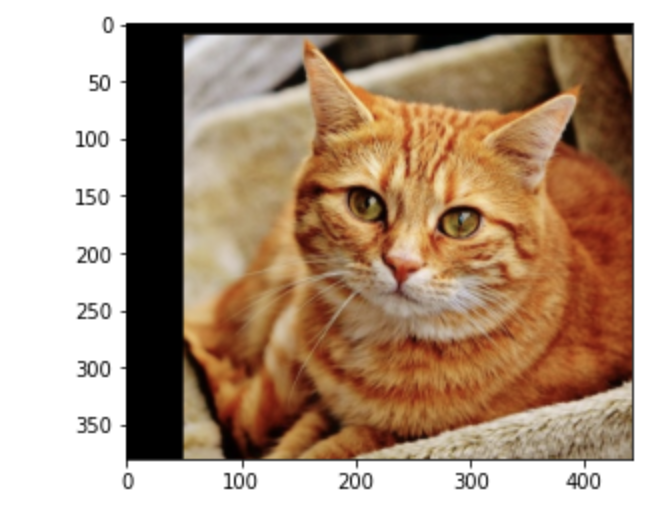
8. 이미지 회전
import cv2
import numpy as np
import matplotlib.pyplot as plt

image = cv2.imread('cat.jpg')

# 행과 열 정보만 저장합니다.
height, width = image.shape[:2]

M = cv2.getRotationMatrix2D((width / 2, height / 2), 90, 0.5)
dst = cv2.warpAffine(image, M, (width, height))

plt.imshow(cv2.cvtColor(dst, cv2.COLOR_BGR2RGB))
plt.show()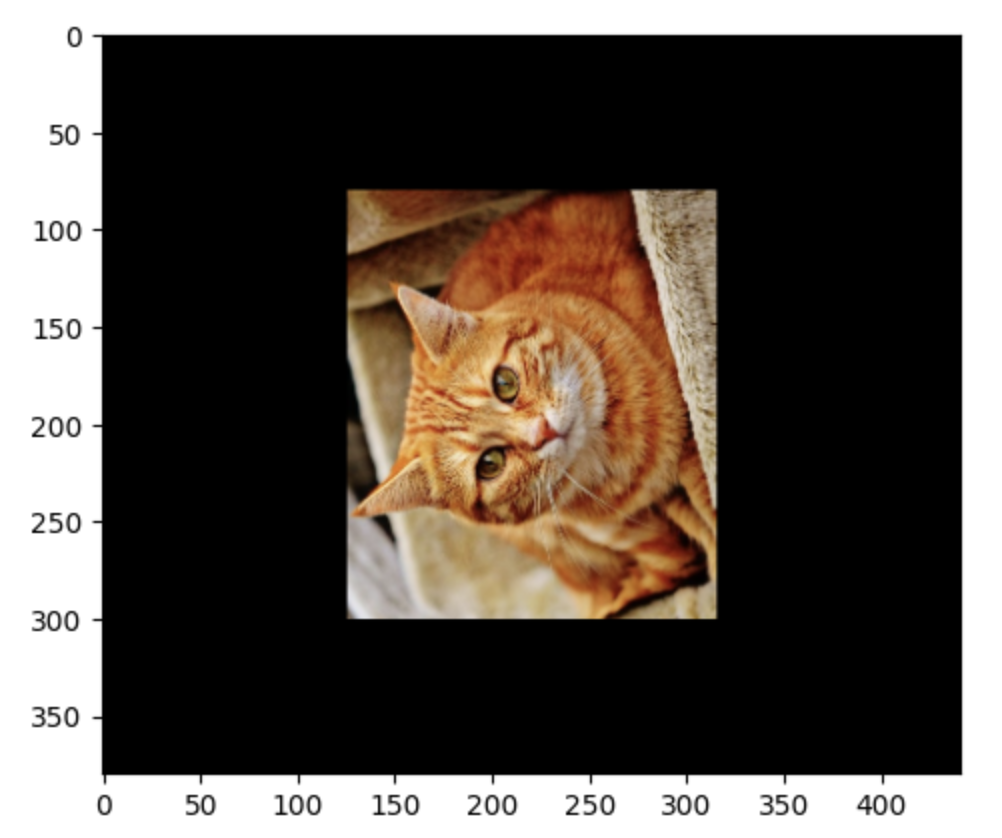
9. 이미지 합치기
import cv2
import matplotlib.pyplot as plt

image_1 = cv2.imread('background.jpg')
image_2 = cv2.imread('keyboard.png')

result = cv2.add(image_1, image_2)
plt.imshow(cv2.cvtColor(result, cv2.COLOR_BGR2RGB))
plt.show()

result = image_1 + image_2
plt.imshow(cv2.cvtColor(result, cv2.COLOR_BGR2RGB))
plt.show()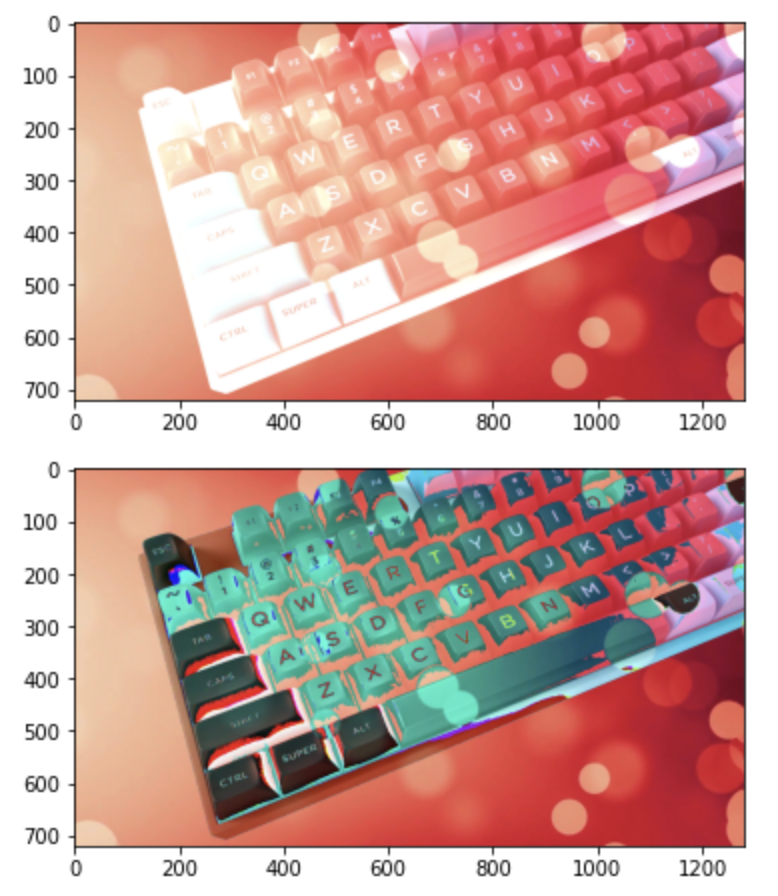
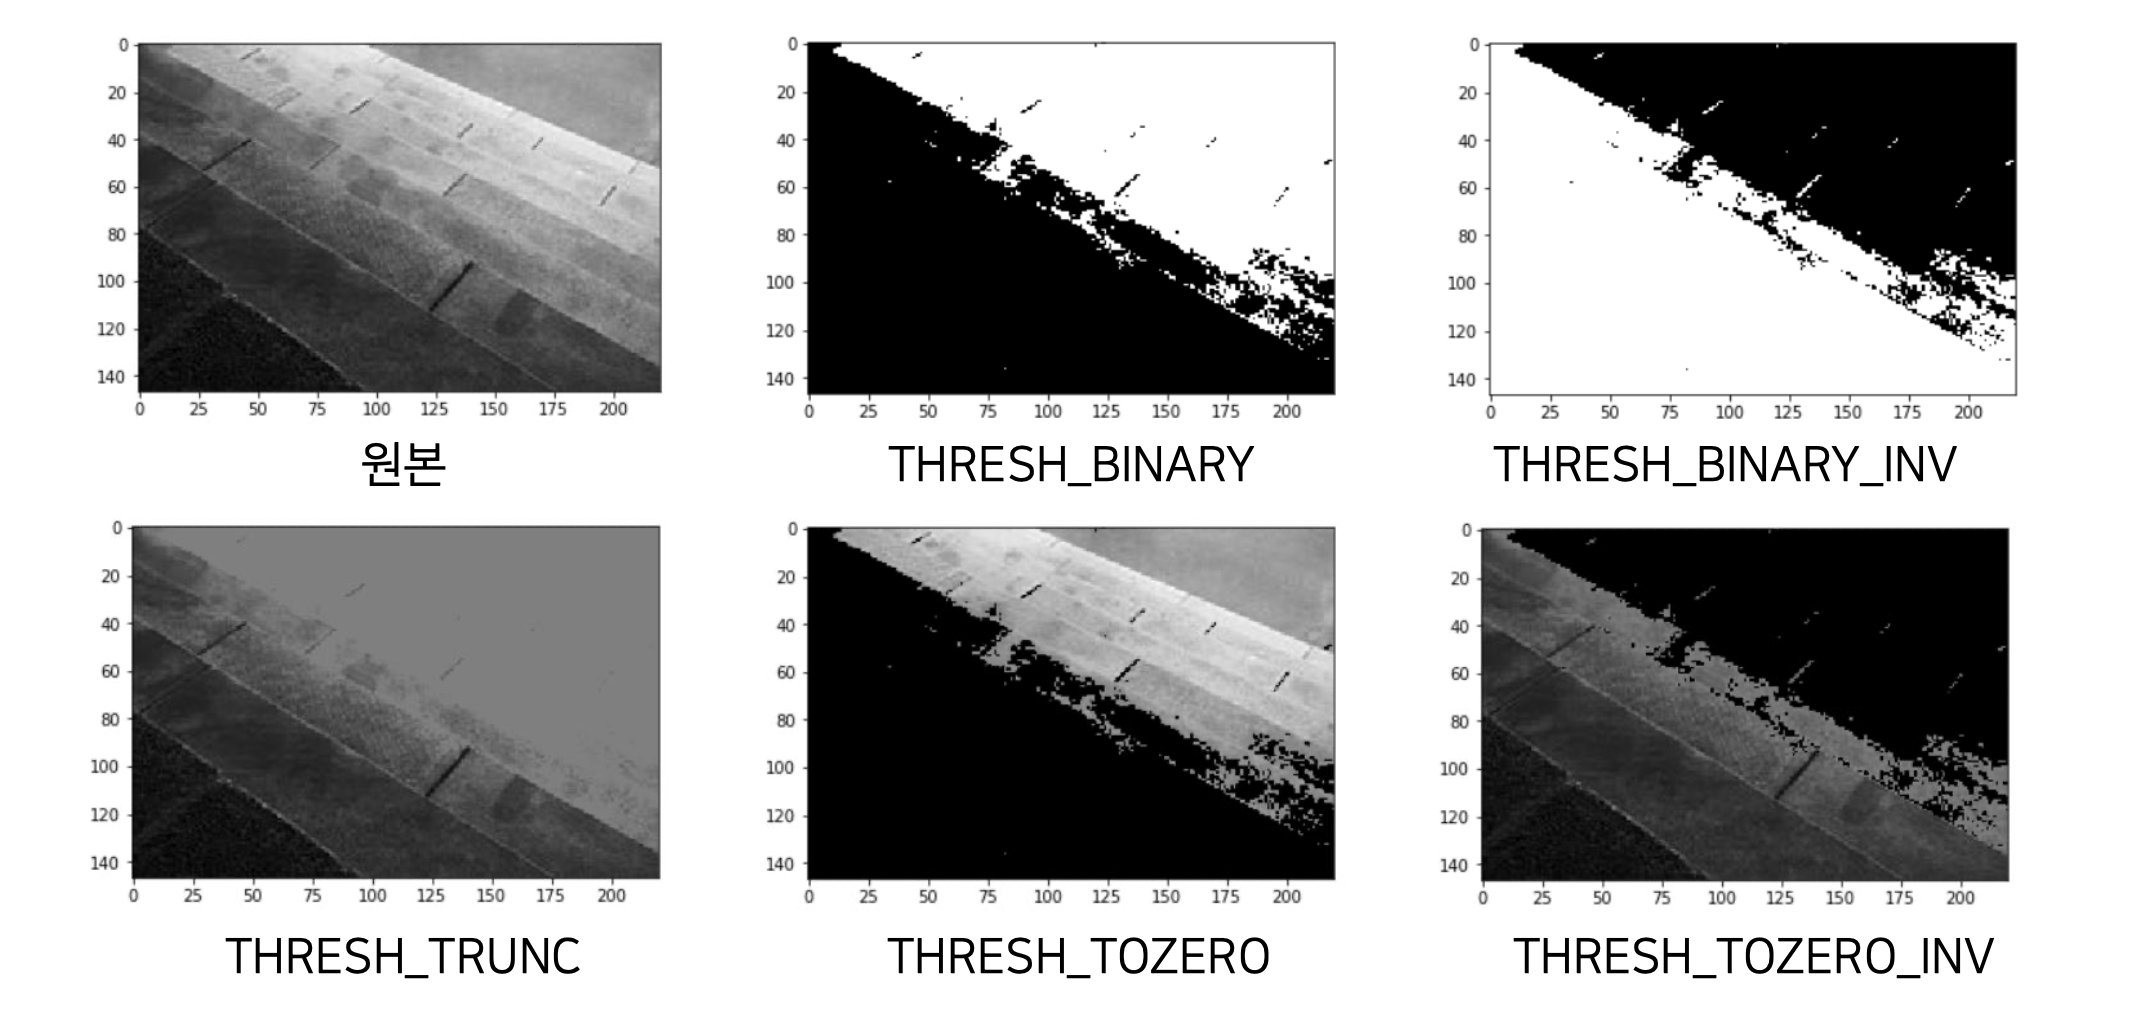
10. 이미지 이진화
import cv2
import matplotlib.pyplot as plt

image = cv2.imread('gray_image.jpg', cv2.IMREAD_GRAYSCALE)

images = []
ret, thres1 = cv2.threshold(image, 127, 255, cv2.THRESH_BINARY)
ret, thres2 = cv2.threshold(image, 127, 255, cv2.THRESH_BINARY_INV)
ret, thres3 = cv2.threshold(image, 127, 255, cv2.THRESH_TRUNC)
ret, thres4 = cv2.threshold(image, 127, 255, cv2.THRESH_TOZERO)
ret, thres5 = cv2.threshold(image, 127, 255, cv2.THRESH_TOZERO_INV)
images.append(thres1)
images.append(thres2)
images.append(thres3)
images.append(thres4)
images.append(thres5)

for i in images:
    plt.imshow(cv2.cvtColor(i, cv2.COLOR_GRAY2RGB))
    plt.show()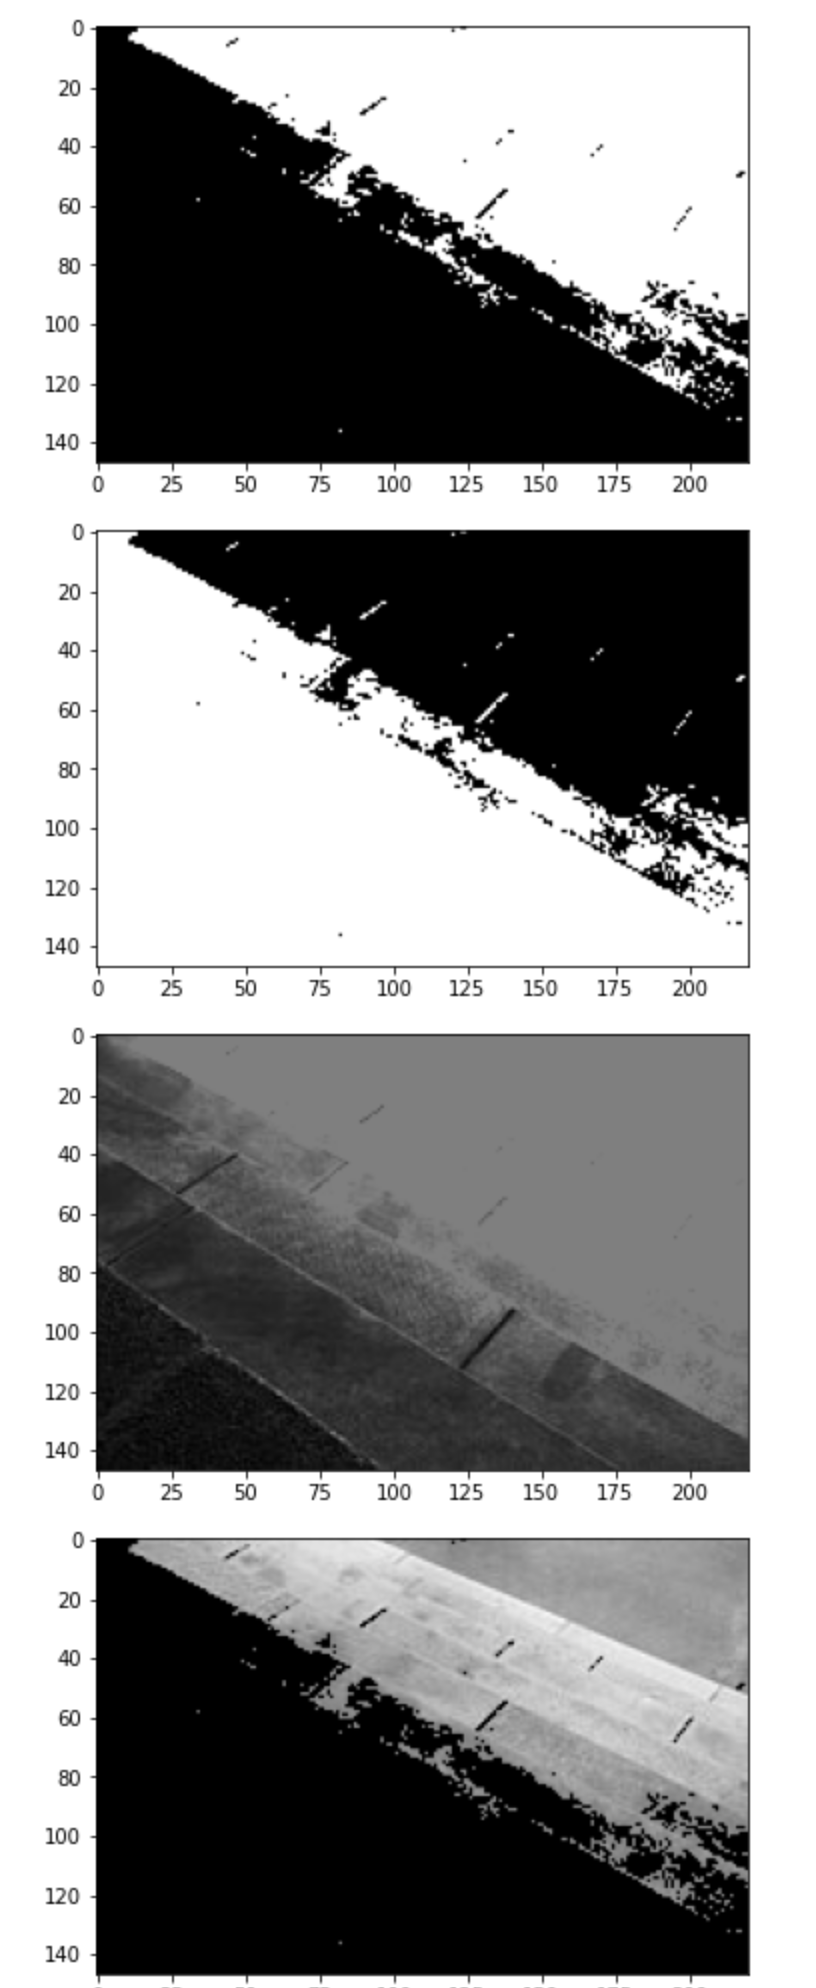
11. 이미지 적응 임계점 처리
import cv2

image = cv2.imread('hand_writing_image.jpg', cv2.IMREAD_GRAYSCALE)

ret, thres1 = cv2.threshold(image, 127, 255, cv2.THRESH_BINARY)
thres2 = cv2.adaptiveThreshold(image, 255, cv2.ADAPTIVE_THRESH_MEAN_C, cv2.THRESH_BINARY, 21, 3)

plt.imshow(cv2.cvtColor(image, cv2.COLOR_GRAY2RGB))
plt.show()

plt.imshow(cv2.cvtColor(thres1, cv2.COLOR_GRAY2RGB))
plt.show()

plt.imshow(cv2.cvtColor(thres2, cv2.COLOR_GRAY2RGB))
plt.show()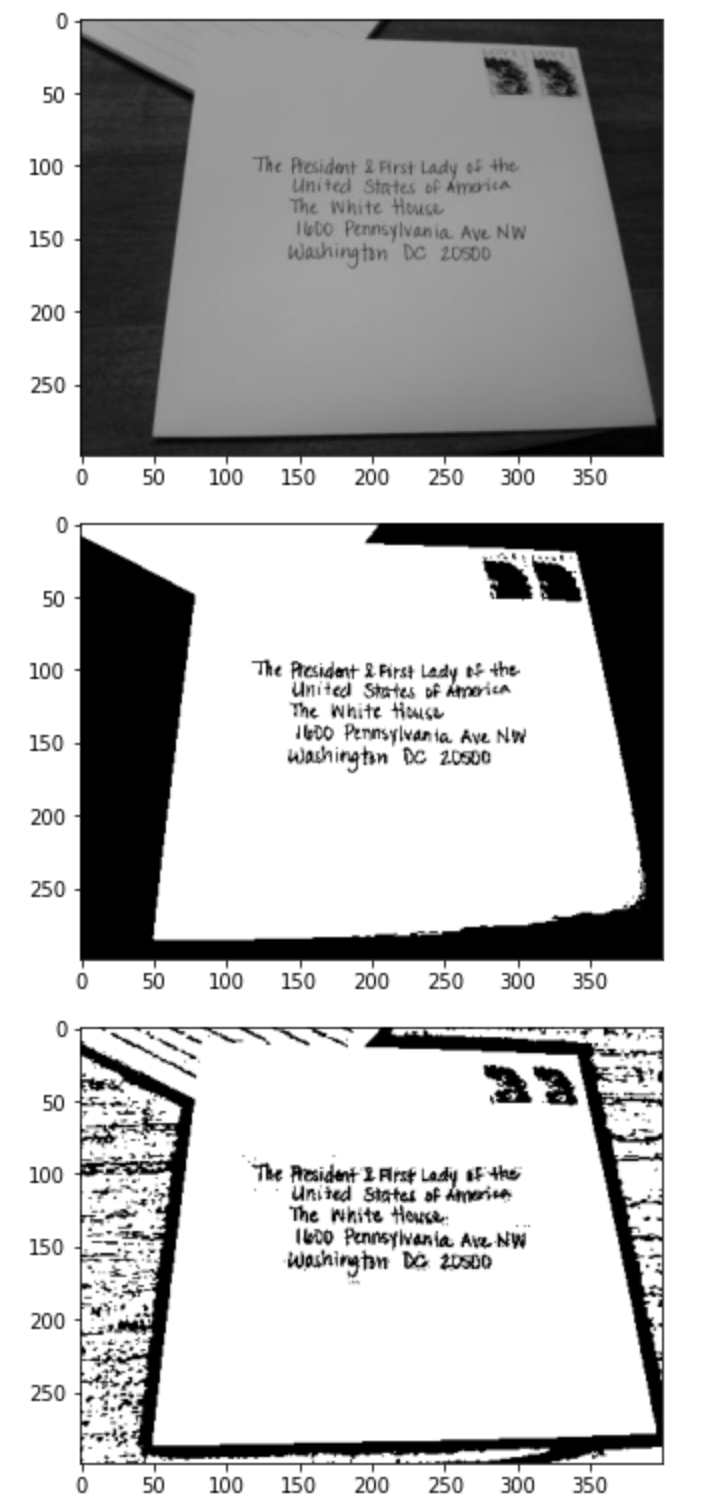
12. contours 기본 사용법
import cv2
import matplotlib.pyplot as plt

image = cv2.imread('gray_image.jpg')
image_gray = cv2.cvtColor(image, cv2.COLOR_BGR2GRAY)
ret, thresh = cv2.threshold(image_gray, 127, 255, 0)

plt.imshow(cv2.cvtColor(thresh, cv2.COLOR_GRAY2RGB))
plt.show()

contours = cv2.findContours(thresh, cv2.RETR_TREE, cv2.CHAIN_APPROX_SIMPLE)[0]
image = cv2.drawContours(image, contours, -1, (0, 255, 0), 4)

plt.imshow(cv2.cvtColor(image, cv2.COLOR_BGR2RGB))
plt.show()
13. contours 의 사각형 외곽찾기
import cv2
import matplotlib.pyplot as plt

image = cv2.imread('digit_image.png')
image_gray = cv2.cvtColor(image, cv2.COLOR_BGR2GRAY)
ret, thresh = cv2.threshold(image_gray, 230, 255, 0)
thresh = cv2.bitwise_not(thresh)

plt.imshow(cv2.cvtColor(thresh, cv2.COLOR_GRAY2RGB))
plt.show()

contours = cv2.findContours(thresh, cv2.RETR_TREE, cv2.CHAIN_APPROX_SIMPLE)[0]
image = cv2.drawContours(image, contours, -1, (0, 0, 255), 4)

plt.imshow(cv2.cvtColor(image, cv2.COLOR_BGR2RGB))
plt.show()

contour = contours[0]
x, y, w, h = cv2.boundingRect(contour)
image = cv2.rectangle(image, (x, y), (x + w, y + h), (0, 0, 255), 3)

plt.imshow(cv2.cvtColor(image, cv2.COLOR_BGR2RGB))
plt.show()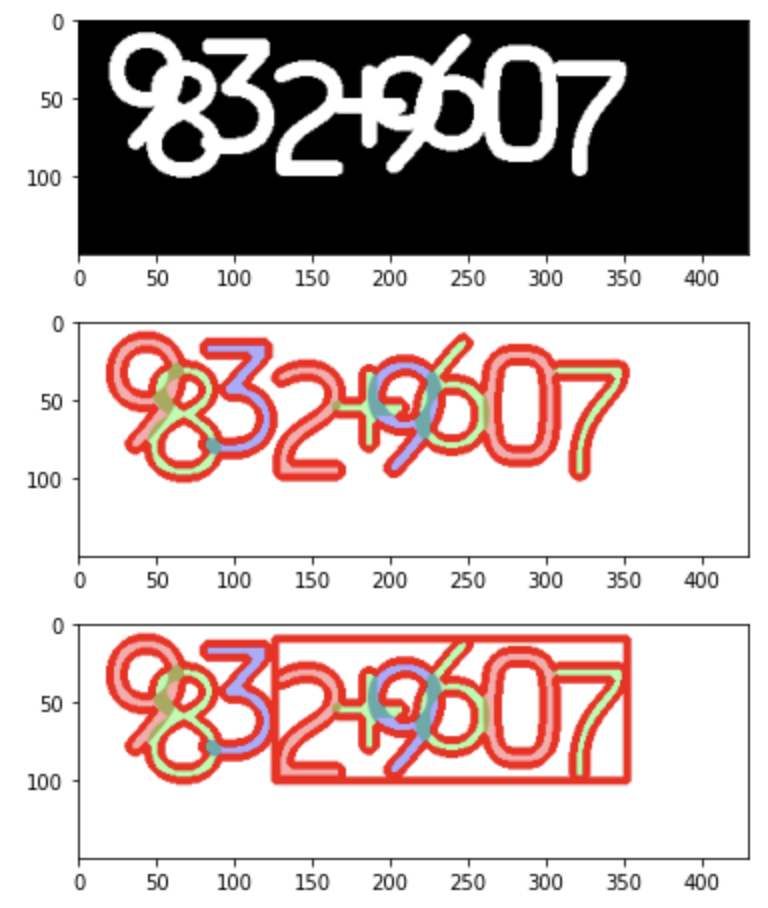
14. contours 의 Convex Hull
import cv2
import matplotlib.pyplot as plt

image = cv2.imread('digit_image.png')
image_gray = cv2.cvtColor(image, cv2.COLOR_BGR2GRAY)
ret, thresh = cv2.threshold(image_gray, 230, 255, 0)
thresh = cv2.bitwise_not(thresh)

contours = cv2.findContours(thresh, cv2.RETR_TREE, cv2.CHAIN_APPROX_SIMPLE)[0]
image = cv2.drawContours(image, contours, -1, (0, 0, 255), 4)

plt.imshow(cv2.cvtColor(image, cv2.COLOR_BGR2RGB))
plt.show()

contour = contours[0]
hull = cv2.convexHull(contour)
image = cv2.drawContours(image, [hull], -1, (255, 0, 0), 4)

plt.imshow(cv2.cvtColor(image, cv2.COLOR_BGR2RGB))
plt.show()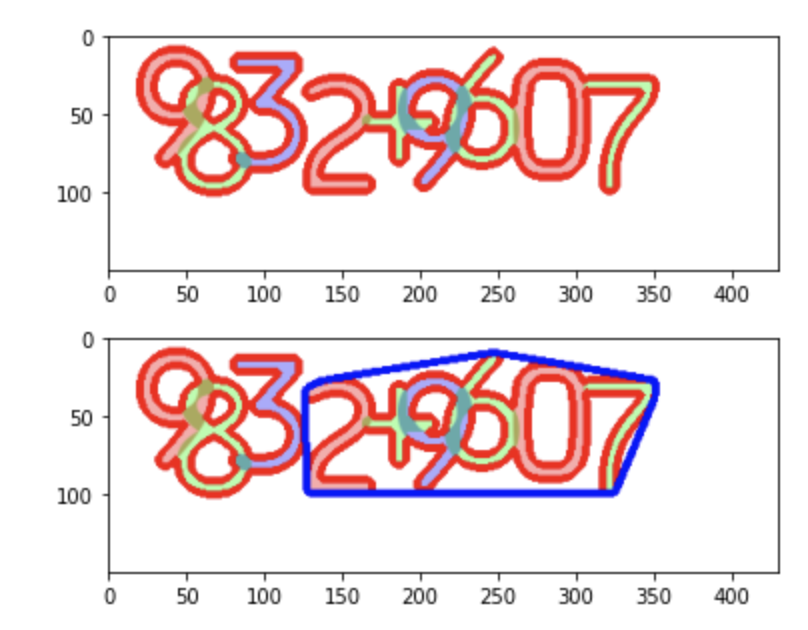
15. contours 의 유사 다각형 찾기
import cv2
import matplotlib.pyplot as plt

image = cv2.imread('digit_image.png')
image_gray = cv2.cvtColor(image, cv2.COLOR_BGR2GRAY)
ret, thresh = cv2.threshold(image_gray, 230, 255, 0)
thresh = cv2.bitwise_not(thresh)

contours = cv2.findContours(thresh, cv2.RETR_TREE, cv2.CHAIN_APPROX_SIMPLE)[0]
image = cv2.drawContours(image, contours, -1, (0, 0, 255), 4)

plt.imshow(cv2.cvtColor(image, cv2.COLOR_BGR2RGB))
plt.show()

contour = contours[0]
epsilon = 0.01 * cv2.arcLength(contour, True)
approx = cv2.approxPolyDP(contour, epsilon, True)
image = cv2.drawContours(image, [approx], -1, (0, 255, 0), 4)

plt.imshow(cv2.cvtColor(image, cv2.COLOR_BGR2RGB))
plt.show()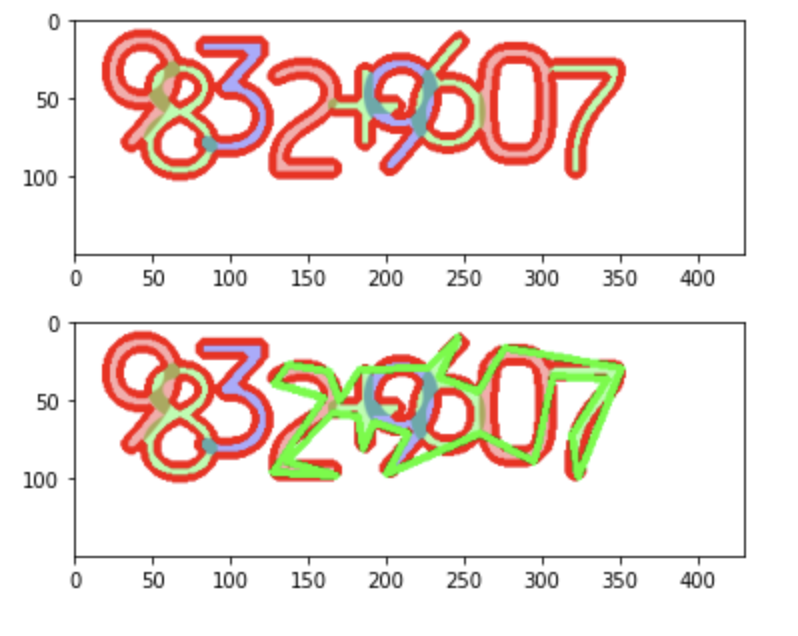
16. Contours의 기본정보
import cv2
import matplotlib.pyplot as plt

image = cv2.imread('digit_image.png')
image_gray = cv2.cvtColor(image, cv2.COLOR_BGR2GRAY)
ret, thresh = cv2.threshold(image_gray, 230, 255, 0)
thresh = cv2.bitwise_not(thresh)

contours = cv2.findContours(thresh, cv2.RETR_TREE, cv2.CHAIN_APPROX_SIMPLE)[0]
image = cv2.drawContours(image, contours, -1, (0, 0, 255), 4)

contour = contours[0]
area = cv2.contourArea(contour)
print(area)

length = cv2.arcLength(contour, True)
print(length)

M = cv2.moments(contour)
print(M)

plt.imshow(cv2.cvtColor(image, cv2.COLOR_BGR2RGB))
plt.show()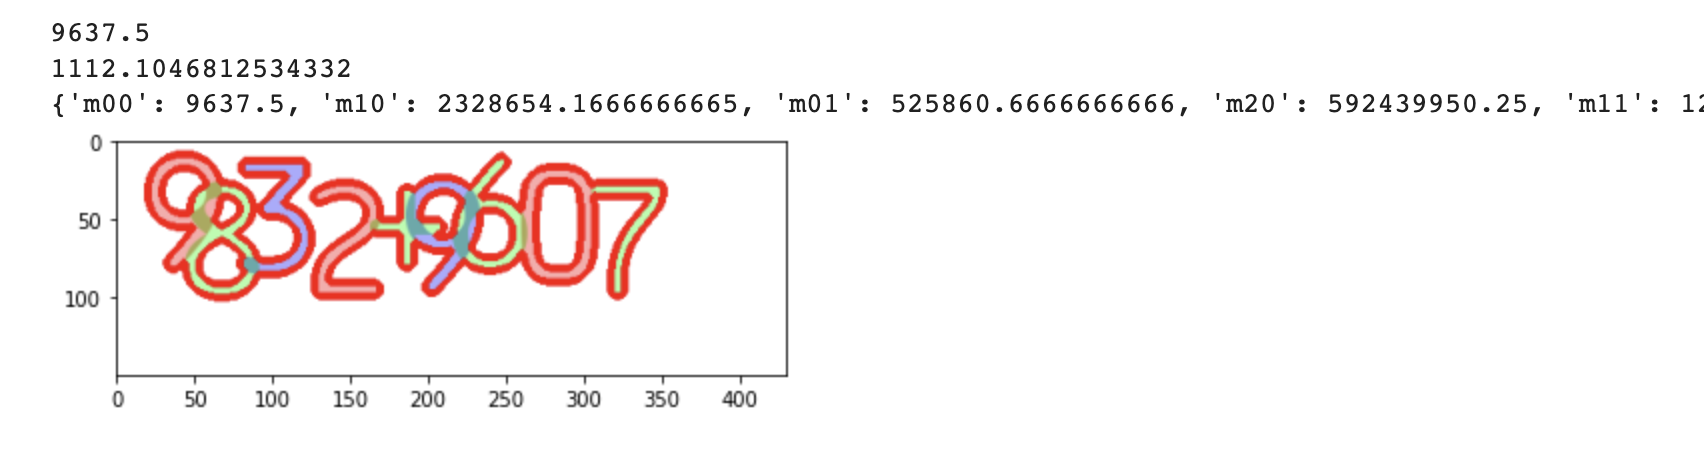
17. Filtering - 직접 커널 단위로 필터 적용하기
import cv2
import matplotlib.pyplot as plt
import numpy as np

image = cv2.imread('gray_image.jpg')
plt.imshow(cv2.cvtColor(image, cv2.COLOR_BGR2RGB))
plt.show()

size = 4
kernel = np.ones((size, size), np.float32) / (size ** 2)
print(kernel)

dst = cv2.filter2D(image, -1, kernel)
plt.imshow(cv2.cvtColor(dst, cv2.COLOR_BGR2RGB))
plt.show()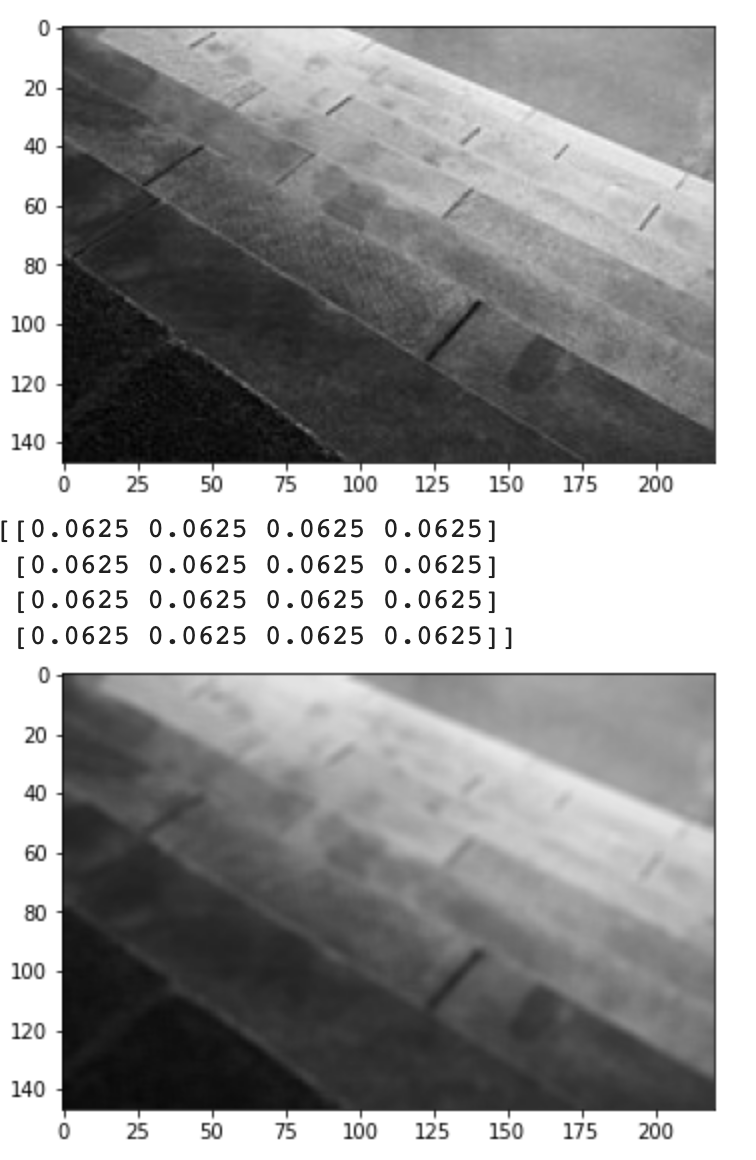
18. Filtering - Basic Blur
import cv2
import matplotlib.pyplot as plt

image = cv2.imread('gray_image.jpg')
plt.imshow(cv2.cvtColor(image, cv2.COLOR_BGR2RGB))
plt.show()

dst = cv2.blur(image, (4, 4))
plt.imshow(cv2.cvtColor(dst, cv2.COLOR_BGR2RGB))
plt.show()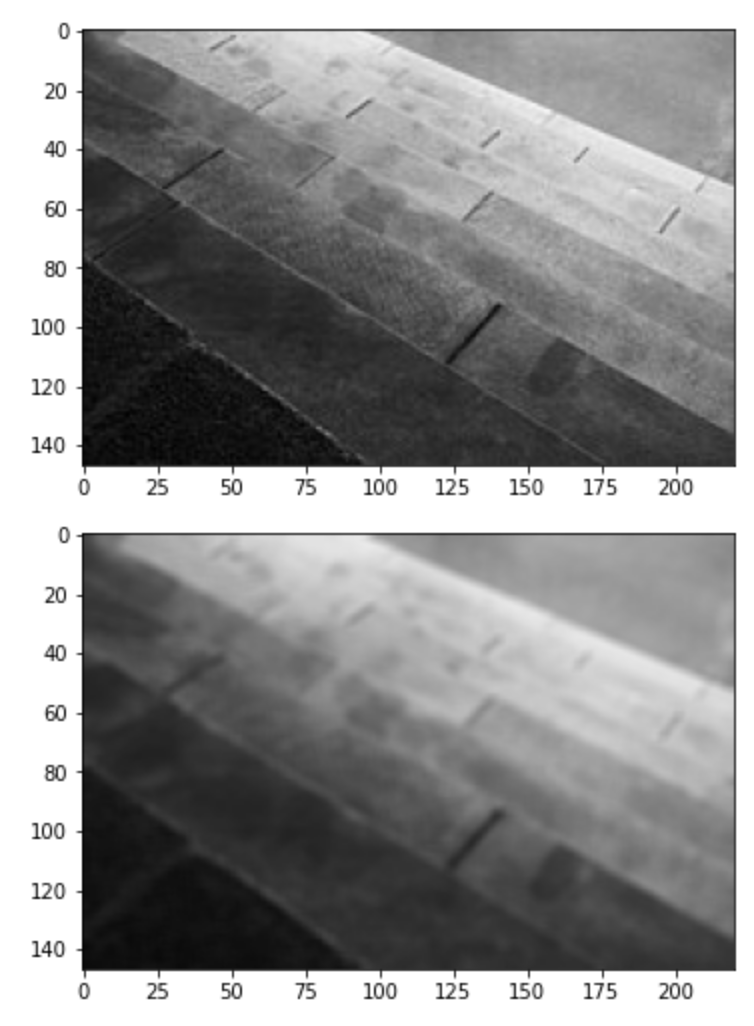
19. Filtering - Gaussian Blur
import cv2

image = cv2.imread('gray_image.jpg')
plt.imshow(cv2.cvtColor(image, cv2.COLOR_BGR2RGB))
plt.show()

# kernel_size: 홀수
dst = cv2.GaussianBlur(image, (5, 5), 0)
plt.imshow(cv2.cvtColor(dst, cv2.COLOR_BGR2RGB))
plt.show()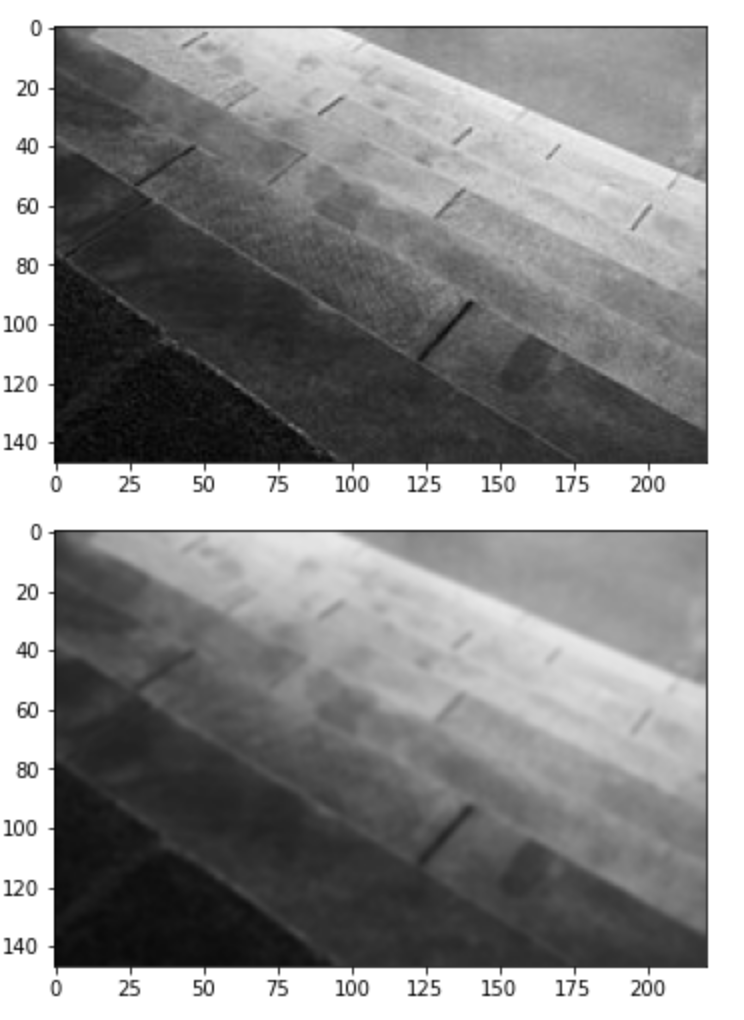
'인공지능공부' 카테고리의 다른 글
| Linear Regression 바닥부터 구현하기 ( bias 없을때 ) (0) | 2023.07.14 |
|---|---|
| Matplotlib 에 대해 알아보자! (0) | 2023.07.07 |
| Pandas 에 대해 알아보자 feat. Series, DataFrame (0) | 2023.07.07 |
| Numpy 에 대해 알아보자 (0) | 2023.07.05 |
| 활성화 함수가 필요한 이유는 무엇일까? (0) | 2022.01.16 |


