
| 일 | 월 | 화 | 수 | 목 | 금 | 토 |
|---|---|---|---|---|---|---|
| 1 | 2 | 3 | 4 | 5 | ||
| 6 | 7 | 8 | 9 | 10 | 11 | 12 |
| 13 | 14 | 15 | 16 | 17 | 18 | 19 |
| 20 | 21 | 22 | 23 | 24 | 25 | 26 |
| 27 | 28 | 29 | 30 |
Tags
- 피플
- 회귀
- 선형회귀
- 인공지능
- map
- 자연어처리
- filtering
- 유데미
- 42경산
- 42서울
- mnist
- 데이터분석
- 머신러닝
- 크롤러
- 딥러닝
- RNN
- Regression
- Computer Vision
- 선형대수학
- 지정헌혈
- 코딩애플
- AI
- Flutter
- CV
- pytorch
- 앱개발
- 플러터
- 파이썬
- 모델
- 크롤링
Archives
- Today
- Total
David의 개발 이야기!
SVR 서포트벡터머신 체험하기! 본문
반응형
sklearn, 서포트벡터 머신을 활용해서, 호봉에 따른 임금상승을 구해보자!
1. Import Libraries
2. Import Dataset
3. Feature Scaling
4. Training the SVR model
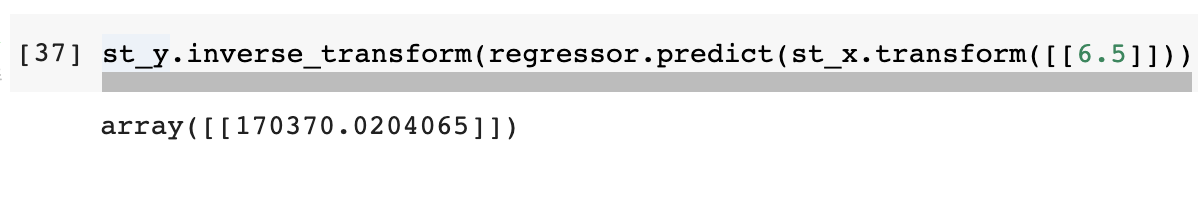
5. Predicting the new result
6. Visualizing the SVR results.
다음과 같은 순서로 분석하고자 한다!

1. Import libraries
import numpy as np
import pandas as pd
import matplotlib.pyplot as plt
2. Import Dataset
dataset = pd.read_csv("Position_Salaries.csv")

x = dataset.iloc[:,1:-1].values
y = dataset.iloc[:,-1].values
3. Feature Scaling
-> Feature Scaling은 표준화(standardization) 또는 정규화(normalization)를 의미한다.
from sklearn.preprocessing import StandardScaler

std_x = StandardScaler()
std_y = StandardScaler()

x = std_x.fit_transform(x.reshape(len(x),1))
y = std_x.fit_transform(y.reshape(len(y),1))
* x, y는 각각 정규화를 해주어야한다!
4. Training the SVR model
from sklearn.SVM import SVR

regressor = SVR(kernel='rbf')
regressor.fit(x, y)
5. Predicting the new result
std_y.inverse_transform(regressor.predict(std_x.transform([[6.5]])))# 6.5를 x 정규화된 값에 대입 -> x정규화된걸로 predict -> inverse_transform으로 실제값 역변환! 하는 순
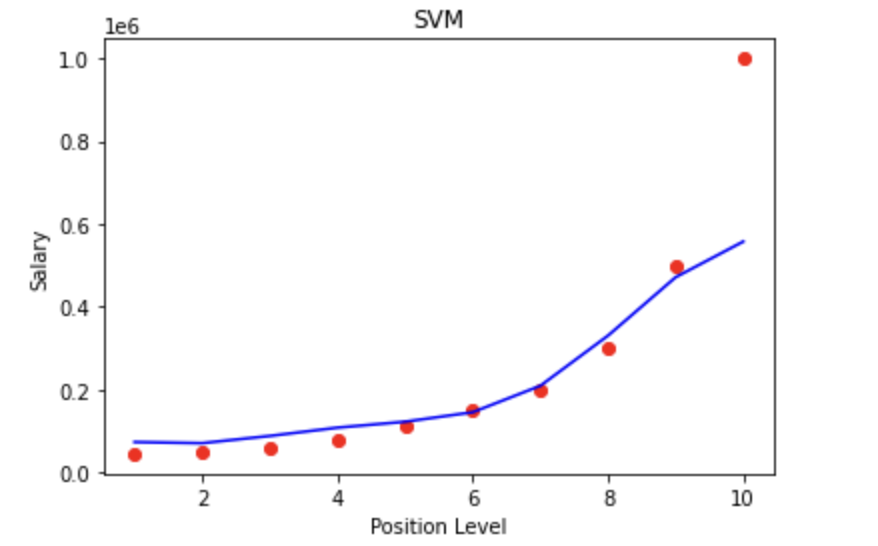
6. Visualizing the SVR results.
plt.scatter(st_x.inverse_transform(x), st_y.inverse_transform(y), color='red')
plt.plot(st_x.inverse_transform(x), st_y.inverse_transform(regressor.predict(x).reshape(-1,1)), color='blue')
plt.title('SVM')
plt.xlabel('Position Level')
plt.ylabel('Salary')
반응형
'Udemy Python Machine Learning A-Z' 카테고리의 다른 글
| 랜덤포레스트 에 대해 알아보자! (0) | 2022.11.10 |
|---|---|
| 의사결정트리 회귀에 대해 알아보자! (0) | 2022.11.10 |
| Polynomial Regression 다항회귀에 대해 알아보자! (0) | 2022.09.12 |
| [ 파트2 섹션7 ] Multiple Linear Regression 다중선형회귀에 대해 알아보자! (1) | 2022.09.11 |
| [파트2 섹션6] 단순회귀 Simple Regression (0) | 2022.09.11 |
'Udemy Python Machine Learning A-Z' Related Articles
more


Comments